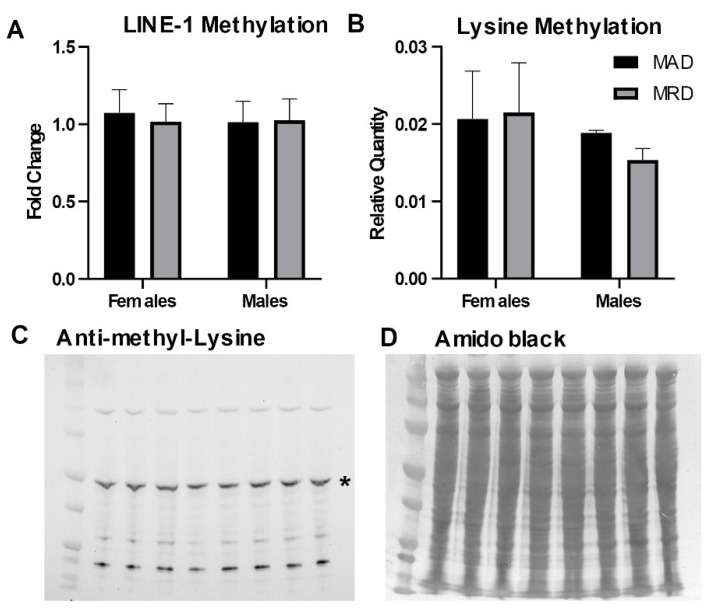
Figure 2.
DNA and protein methylation. Panel (A). DNA methylation in the 5’UTR of the LINE-1 repetitive element measured by methylation-sensitive digestion followed by PCR amplification. Panels (B–D): Immunoblot against mono- and di-methylated lysines. The asterisk (*) in panel (C) indicates the band analyzed in panel (B). Mean ± SEM, MAD: methionine adequate diet, MRD: methionine-restricted diet. Data were analyzed using a two-way ANOVA followed by Sidak’s multiple comparisons test to compare the two diets within each sex.

