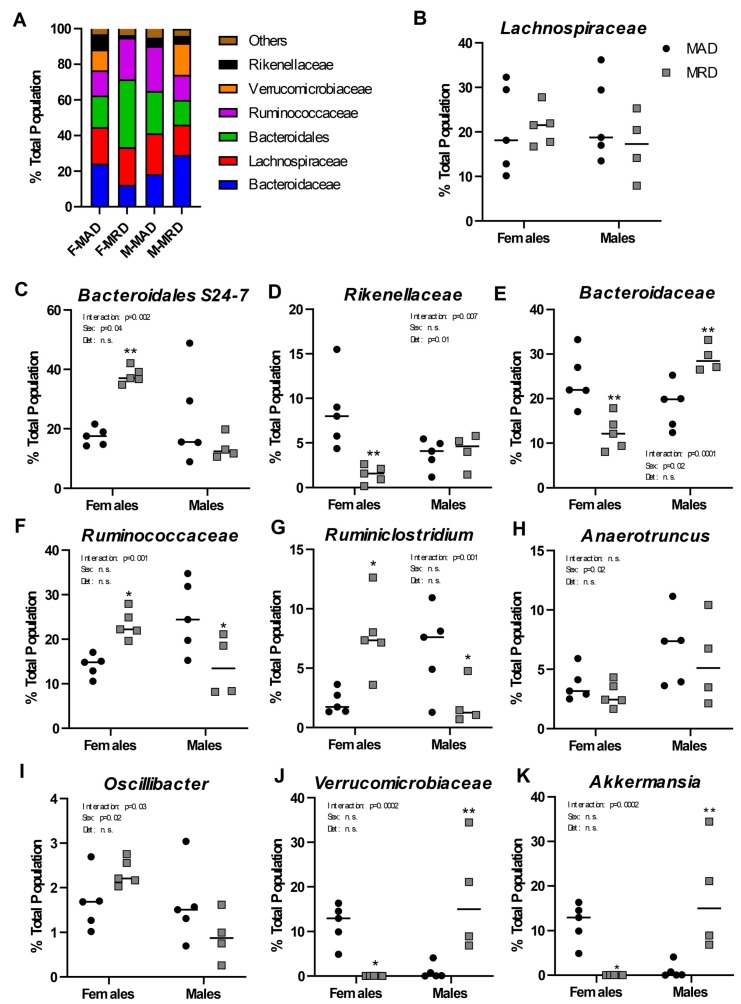
Figure 3.
Changes in microbial populations. Panel (A). Overview of the bacterial families present in samples from each group as a function of % of the total population. Panels (B–K). Abundance of bacterial families (B,D–F,J) or genera (C,G–I,K) in male and females by diet group. Mean ±SEM, MAD: methionine adequate diet, MRD: methionine-restricted diet. Data were analyzed using a two-way ANOVA followed by Sidak’s multiple comparisons test to compare the two diets within each sex. * indicates p ≤ 0.05, ** indicates p ≤ 0.01, and *** indicates p ≤ 0.001. n.s. = Non significant.

