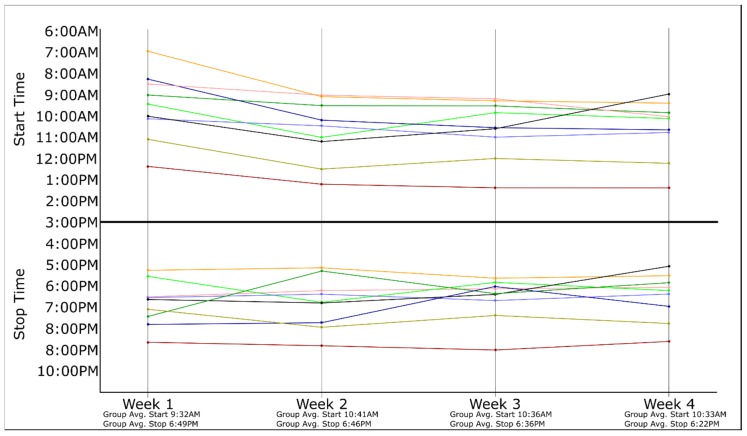
Figure 1.
Self-selected start and stop times for each participant’s eating window. N = 9 for each of the four weeks. Each participant’s average weekly self-reported start/stop times are indicated by differing colors, with each line representing a single participant. The time between “Start Time” and “Stop Time” is indicative of each participant’s eating window.

