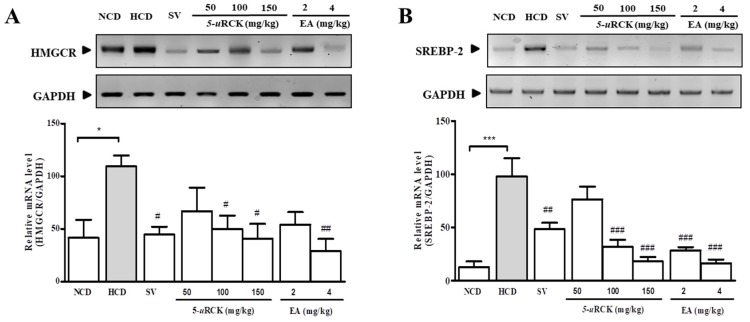
Figure 7.
Effects of 5-uRCK or ellagic acid (EA) on the expression of HMGCR and SREBP-2 in the livers of rats fed an HCD. Relative mRNA expression of 3-hydroxy-3-methyl-glutaryl-CoA reductase (HMGCR) (A) and SREBP-2 (B) was analyzed after 5-uRCK or ellagic acid treatment for five weeks. The gene expression levels were quantified by qPCR. Experiment was repeated independently three times (n = 6–8 rats per group each time) and the RT-PCR product is representative of one of them. Each bar graph represents the mean ± SD of 6–8 rats per group (n = 6–8 rats/group, 3 times repeat). P values for comparisons with control groups (NCD groups) are denoted as * p < 0.05 and *** p < 0.001, and those for comparisons with HCD groups are denoted as # p < 0.05, ## p < 0.01, and ### p < 0.001.

