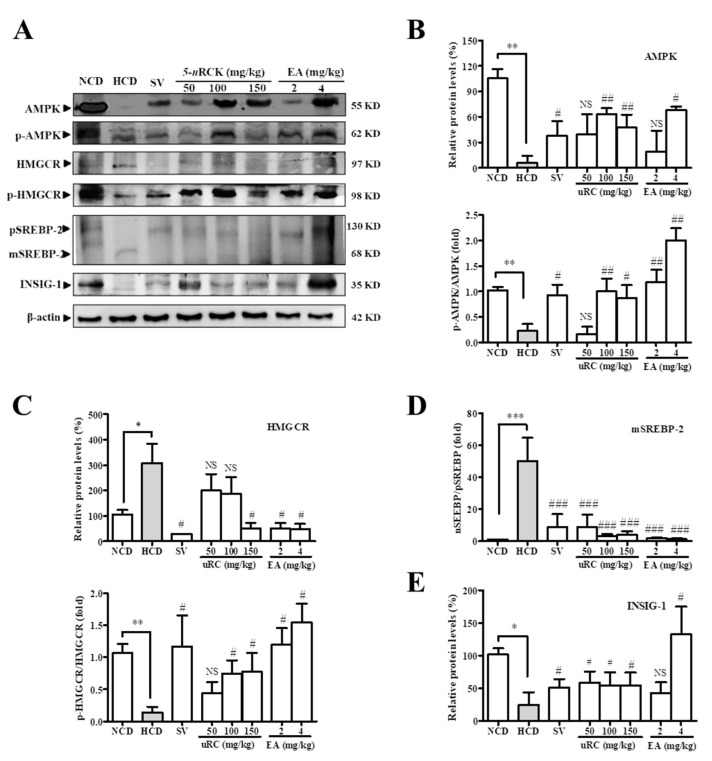
Figure 8.
Effects of 5-uRCK or ellagic acid (EA) on the phosphorylation of AMPK and the expression of cholesterol biosynthesis-related proteins in the livers of rats fed an HCD. (A) The protein expression levels of p-AMPK, AMPK, p-HMGCR, HMGCR, precursor SREBP-2 (pSREBP-2), mature SREBP-2 (mSREBP-2), and INSIG-1 in liver tissues were measured by Western blotting. (B) The bar graphs indicate the average p-AMPK and AMPK levels. (C) The bar graphs indicate the average p-HMGCR and HMGCR levels. (D) The bar graph indicates the average pSREBP-2 and mSREBP-2 levels. (E) The bar graph indicates the average INSIG-1 levels. The data are expressed as the mean ± SD. P values for comparisons with control groups (NCD groups) are denoted as * p < 0.05, ** p < 0.01 and *** p < 0.001, and those for comparisons with HCD groups are denoted as # p < 0.05, ## p < 0.01, and ### p < 0.001.

