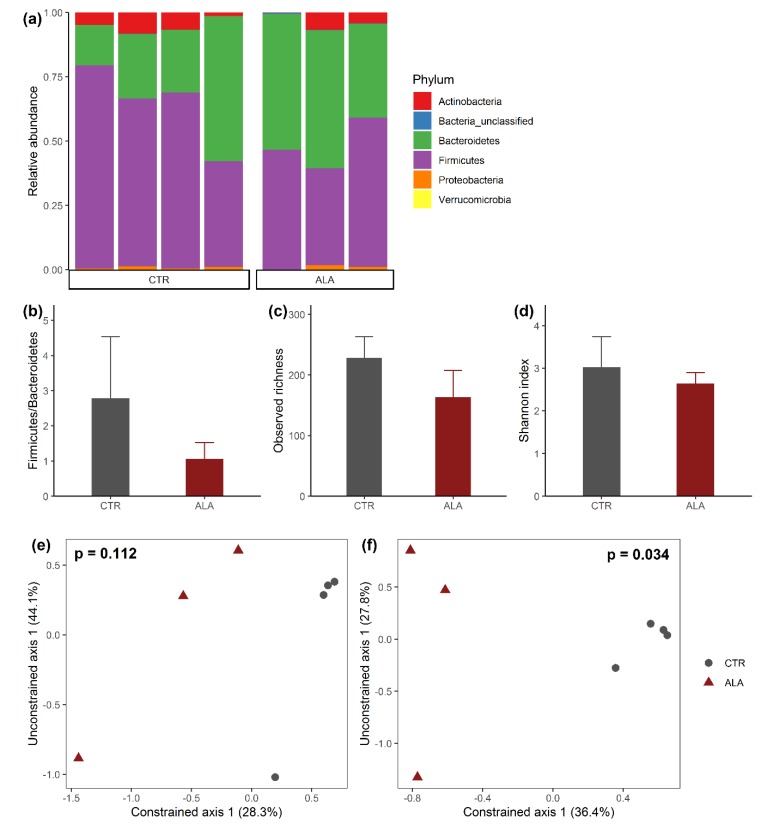
Figure 2.
Microbial composition of the small intestine. (a) Bar plots show the relative abundance of bacterial phyla of individual animals in the control chow (CTR) or α-linolenic acid-rich diet group (ALA). (b) Firmicutes/Bacteroidetes ratio of CTR compared to ALA animals. α-diversity was investigated by estimating (c) the observed richness or (d) the Shannon index. Bar plots show mean + standard deviation for each measure per group. β-diversity was visualized using Canonical analysis of principle coordinates (CAP) based on (e) the Bray–Curtis dissimilarity or (f) binary Jaccard distance. P-values for the constrained axis from CAP were obtained using permutational analysis of variance (PERMANOVA) with 999 permutations. Since the treatment variable has only two levels (CTR or ALA), CAP produced only one constrained multivariate dimension. The percentage of the total inertia captured by each multivariate dimension is shown in brackets on the plots.

