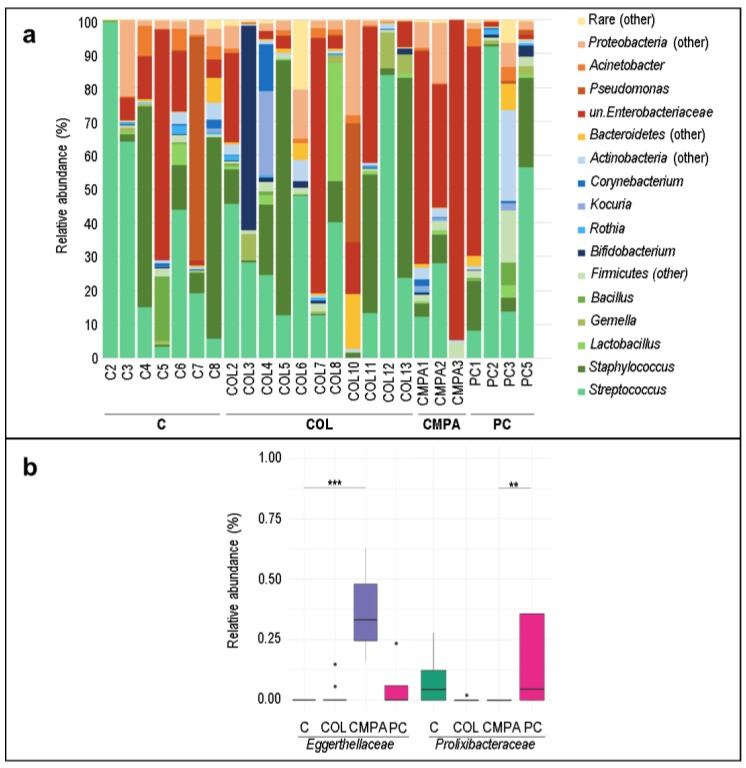
Figure 3.
Bacterial composition of milk samples: (a) Relative abundance of the major bacterial genera detected in ≥ 15% of the milk samples; (b) Relative abundances of the significantly different bacterial families resulting from LEfSe analysis of the milk samples (N = 25). Statistical differences between the study groups are indicated with an asterisk (**, p < 0.05; ***, p < 0.01; Dunn test). C, Control group (n = 7); COL, Colic group (n = 11); CMPA, Cow’s milk protein allergy group (n = 3); PC, Proctocolitis group (n = 4). In these boxplots, the central rectangle represents the interquartile range (IQR), the line and the cross inside the rectangle show the median and the mean, respectively; the whiskers indicate the maximum and minimum values, and the black dots outside the rectangles are suspected outliers (>1.5 × IQR).

