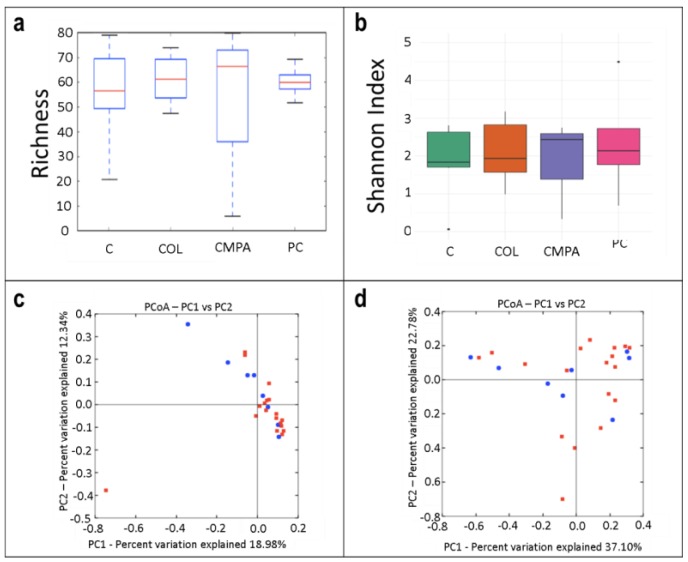
Figure 4.
Alpha diversity in the milk samples (N = 25) in the different study groups expressed by: (a) the number of the observed species (species richness) and (b) the Shannon Index. Beta diversity analysis of the study groups measured as: (c) the presence/absence (Binnary Jaccard method; p = 0.794) and (d) the relative abundance (Bray Curtis method; p = 0.912) of the different species quantified in all disease groups (red) and controls (blue). C, Control group (n = 7); COL, Colic group (n = 11); CMPA, Cow’s milk protein allergy group (n = 3); PC, Proctocolitis group (n = 4).

