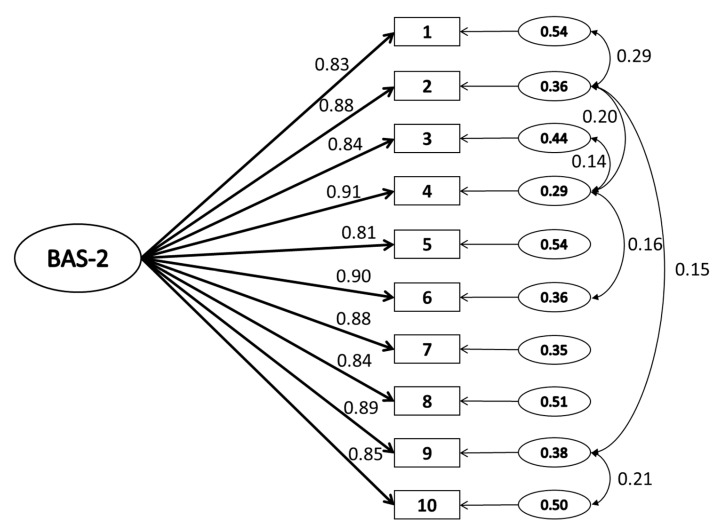
Figure 1.
Path diagram and estimates for the one-dimensional model of Body Appreciation Scale-2 (BAS-2-LT) scores from the second split-half adolescent subsample (n = 706). Note: The large oval is the latent variable, with the rectangles representing measured variables, and the small circles with numbers representing the residual variables (variances). The standardized path factor loadings are presented (all p < 0.001).

