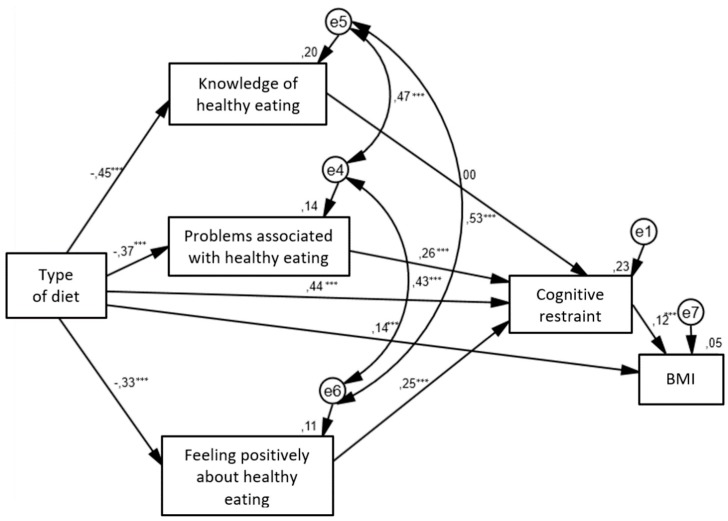
Figure 2.
Structural equation model in adult population.  —observed variable;
  —latent variable;
  —impact of one variable on another; e—residual error in the prediction of an unobserved factor; diet—dichotomous variable (1 = vegetarian diet, 2 = omnivorous diet); BMI—body mass index; * p < 0.05, ** p < 0.01, *** p < 0.001. The values of standardized coefficients and squared multiple correlations (R2; over the observed variables) are presented.

