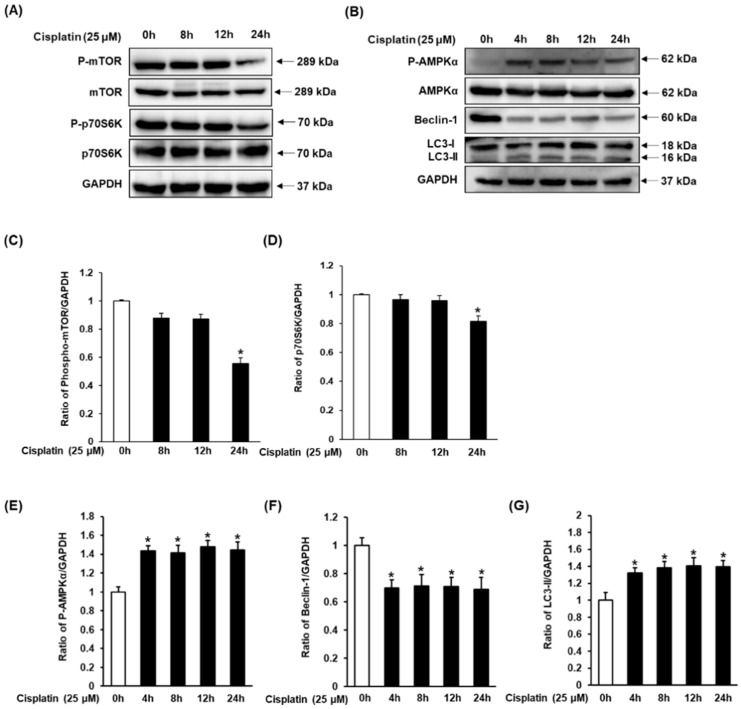
Figure 4.
Time-course protein expressions of (A) phospho-mTOR, mTOR, phospho-p70S6K, p70S6K, and (B) phospho-AMPKα, AMPKα, Beclin-1, and LC3 in LLC-PK1 cells exposed to 25 μM cisplatin by western blotting. (C–G) Bar graphs indicated the relative ratio of the western blot band signals in each group as compared with control cells (mean ± SD, * p < 0.05 cisplatin-treated LLC-PK1 cells). SD, standard deviation.

