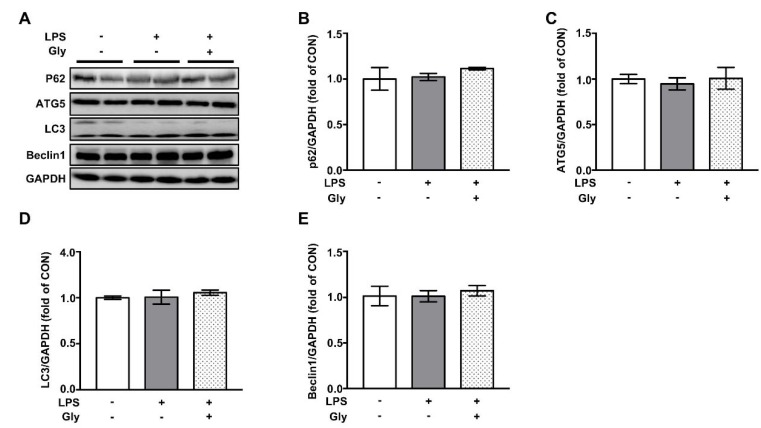
Figure 7.
The protein abundance of autophagy markers in in lung tissues of LPS-challenged mice. (A) Representative protein bands of P62, ATG5, LC3, Beclin1, and GAPDH; (B–E) statistical analysis of protein abundance. The quantification of band in the CON group was set as 1.00 to calibrate the relative levels. GAPDH was used as a loading control. Values are means ± SEM; n = 7. Means without a common letter differ, p < 0.05.

