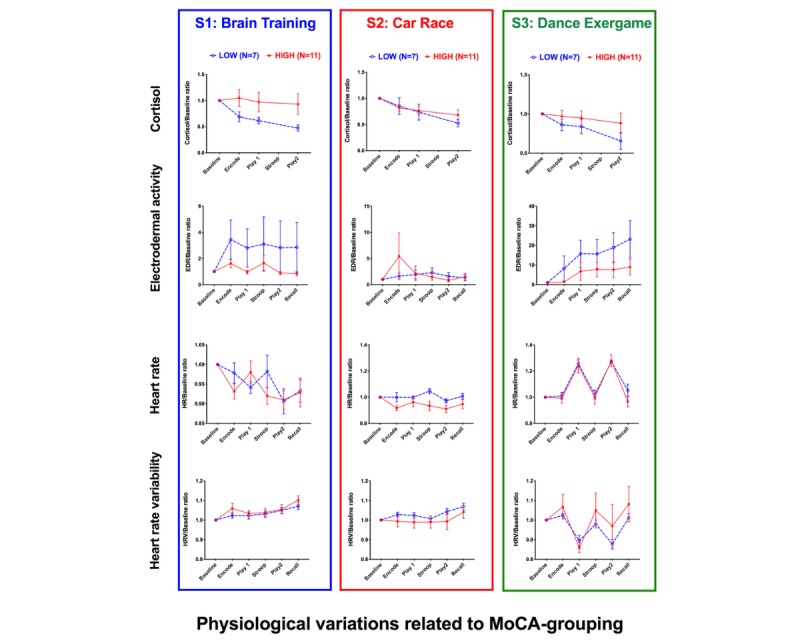
Figure 8.

Group×activity interaction effects. All results shown are normalized to the baseline (within-subject, and within-session) and plotted as mean+standard error of the mean. MoCA: Montreal Cognitive Assessment.

Group×activity interaction effects. All results shown are normalized to the baseline (within-subject, and within-session) and plotted as mean+standard error of the mean. MoCA: Montreal Cognitive Assessment.