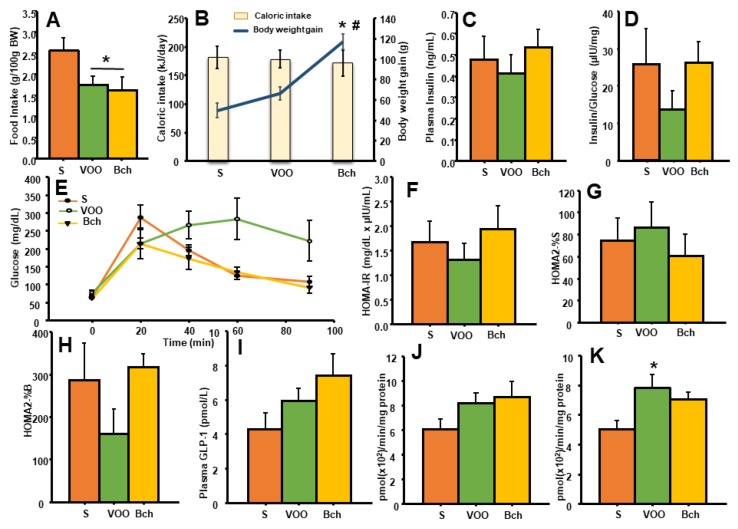
Figure 1.
Means values ± standard errors of daily food intake, expressed as g/100 g Body Weight (A); the intake of energy, expressed as kJ/day and total body weight gain, expressed as g (B); values of plasma fasting insulin, expressed as ng/mL (C); ratio of plasma fasting insulin/glucose, expressed as µIU/mg (D); values of glucose during test tolerance (GTT), expressed as mg/dL (E); homeostasis model of insulin resistance (HOMA-IR), expressed as mg/dL x µIU/mL (F); an index for estimating sensitivity to insulin (% insulin sensitivity) (HOMA2-%S) (G); an index of insulin secretion and a valuation of β-cell usefulness (% β-cell secretion) (HOMA2%B) (H); plasma glucagon-like peptide 1 (GLP-1), expressed as pmol/L (I); and dipeptidyl-peptidase 4 (DPP4) activity in the liver-soluble fraction (J) and membrane-bound fraction (K), expressed as pmol/min/mg prot. S: standard diet, VOO: virgin olive oil diet, Bch: butter plus cholesterol diet. * indicates significant differences between VOO or Bch vs. S, * p < 0.05. # indicates significant differences between VOO and Bch, # p < 0.05.

