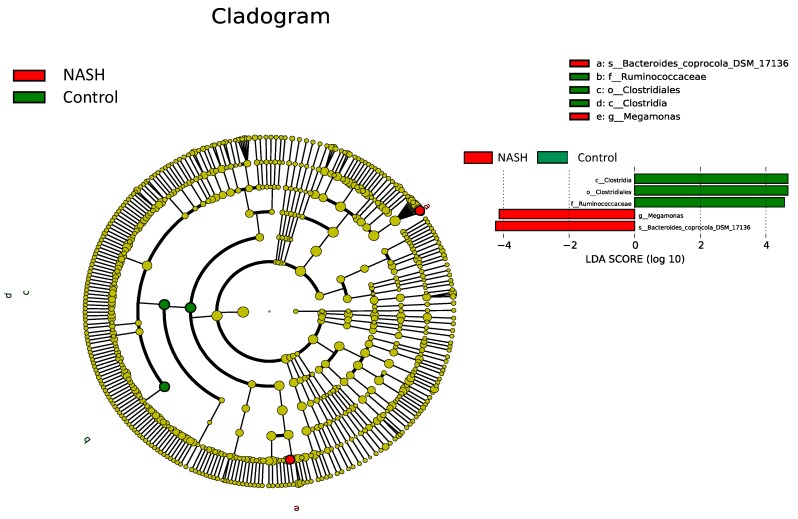
Figure 3.
Linear discriminant analysis effect size (LEfSe) comparison of gut microbiota among healthy, NAFL, and NASH groups. The cladogram displays the taxonomic tree of differentially abundant taxa. The histogram represents the linear discriminant analysis (LDA) scores of bacteria with significant differential abundance between the compared groups identified by different colors.

