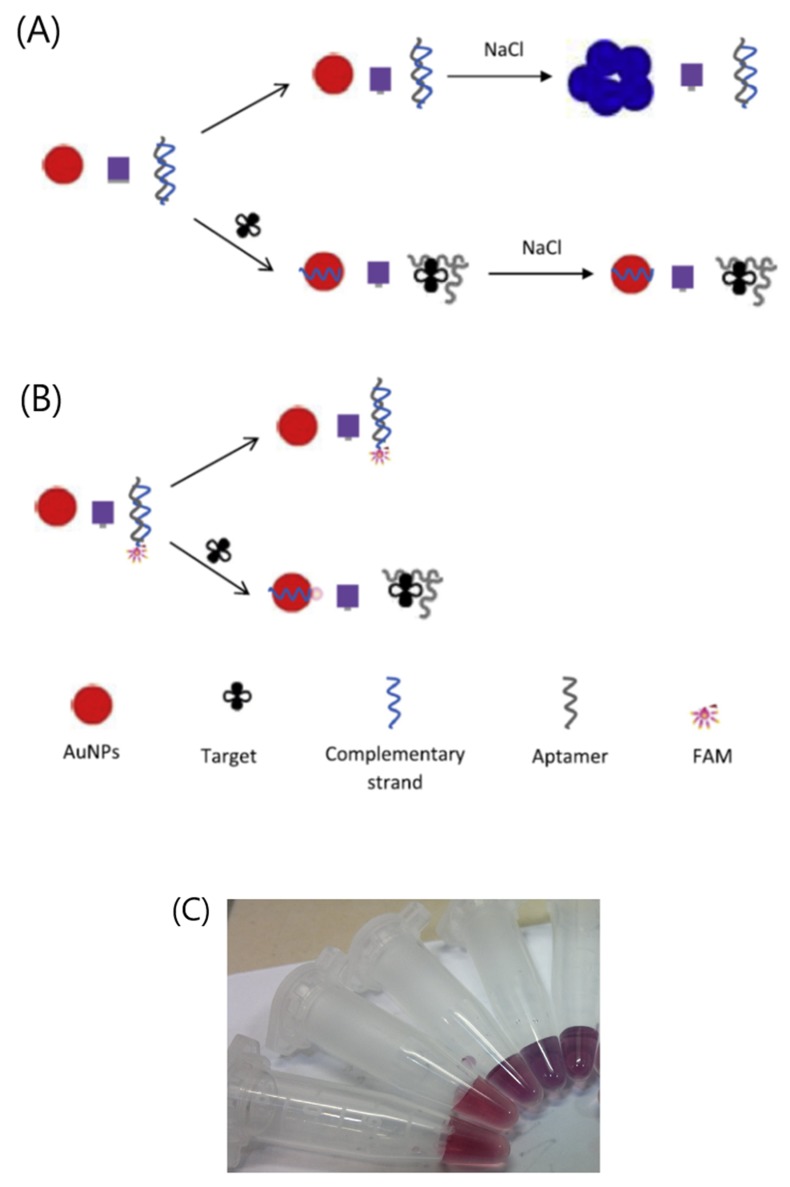
Figure 16.
Schematic description of streptomycin detection based on (A) colorimetric and (B) fluorescence quenching aptasensors, (C) Visual color change upon treatment of AuNPs and dsDNA with different concentrations of streptomycin (0, 30, 300, 2000, 4000 nM, from right to left) [142]. Reprinted from [142]; with permission from Elsevier.

