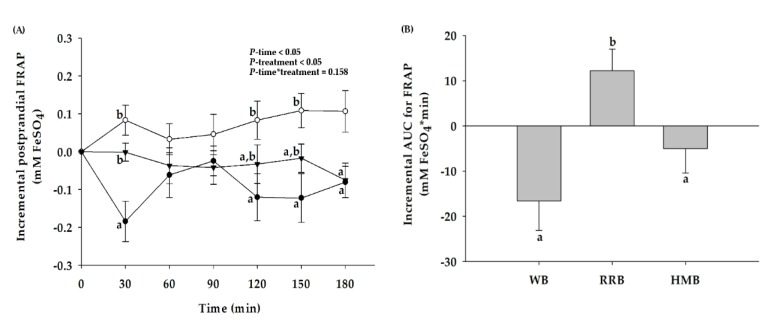
Figure 7.
(A) Changes in postprandial ferric-reducing activity power (FRAP) level and (B) the iAUCs for FRAP level of healthy participants after the consumption of wheat bread (WB), Riceberry rice bread (RRB), and Hom Mali bread (HMB). All values are means ± SEM, n = 16. WB (●), RRB (○), and HMB (▼). For each time point, means with a different letter are significantly different, p < 0.05.

