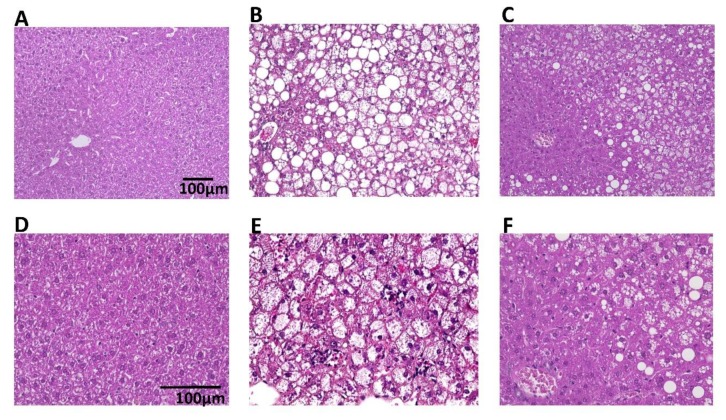
Figure 3.
Representative microscopic images of the liver of mice treated with or without BTS. The liver was taken from mice fed with or without 5% (w/w) BTS for 4 weeks. The specimens were stained with hematoxylin and eosin and examined by light microscopy. (A,D) WILD group, (B,E) CONT group, (C,F) BTS group, (A–C) × 20 magnitude, (D–F) × 40 magnitude.

