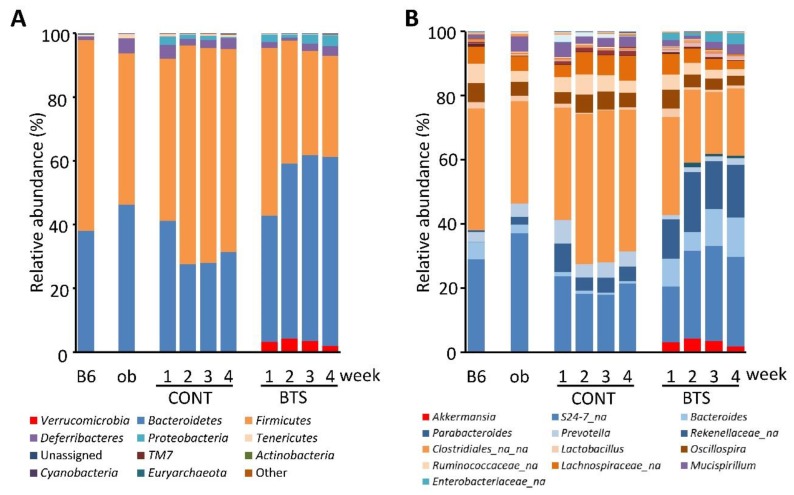
Figure 4.
Microbiota composition in stool samples of mice fed a diet with or without BTS. Stools were collected weekly from mice fed with or without 5% (w/w) BTS. Relative abundance of gut microbiota was determined by 16S metagenome sequence analysis. Average relative abundance at each sampling point is shown as bar charts of phylum (A) and genus (B) levels (n = 6). B6, C57BL/6J mice (seven-week-old); ob, ob/ob mice (seven-week-old); CONT, ob/ob mice fed a standard diet; BTS, ob/ob mice fed a standard diet with 5% BTS.

