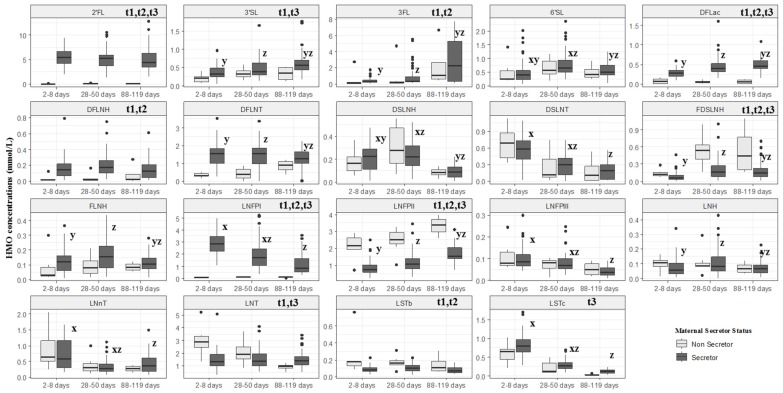
Figure 3.
Box plot of secretor and non-secretor HMOs concentration of women from Brazilian cohort. Rio de Janeiro, Brazil. The description t1, t2 and t3 indicate differences between secretor and non-secretor concentration of according to Mann–Whitney, p < 0.05 for each time. x indicates that the HMO concentration at visit 1 is significantly different (p < 0.05) from the concentration at visit 2, y indicates that the HMO concentration at visit 1 is significantly different (p < 0.05) from the concentration at visit 3 and z indicates that the HMO concentration at visit 2 is significantly different (p < 0.05) from the concentration at visit 3 according to Friedman post-hoc test. A comparison between the times of non-secretor women was not performed.

