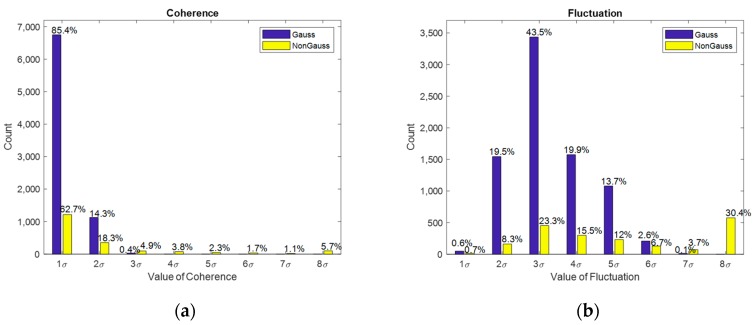
Figure 4.
Statistical distribution of the two features. (a) Probability distribution of consistency. Blue bars indicate the values for Gaussian distribution, and the yellow bars indicate the value for non-Gaussian distribution. (b) Probability distribution of fluctuation. Blue bars indicate the values for Gaussian distribution, and yellow bars indicate the values for non-Gaussian distribution.

