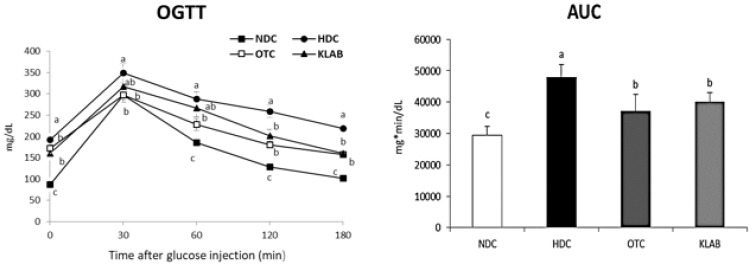
Figure 2.
Oral glucose tolerance test (OGTT) and area under the curve (AUC). a-b-c; Values with different superscripts are significantly different by ANOVA with Duncan’s multiple range test at p < 0.05. NDC: Normal diet control; HDC: High fat diet control; OTC: high-fat diet plus L-ornithine 20 mg/kg; KLAB: High fat diet plus 1 × 10⁹ CFU of L. brevis OPK-3 per mouse.

