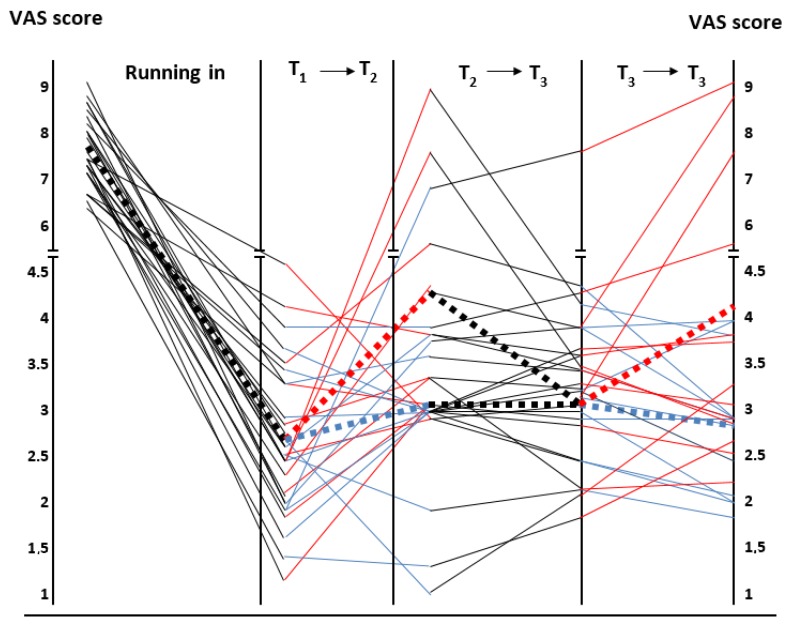
Figure 3.
Graphical representation of the VAS score changes from the beginning to the end of the study. Black continuous lines refer to the phases with low FODMAP-GFD and red and blue continuous lines correspond to the gluten and rice challenge, respectively. The ends of each dotted line represent the mean of the VAS values obtained at the beginning and the end of each phase of the study.

