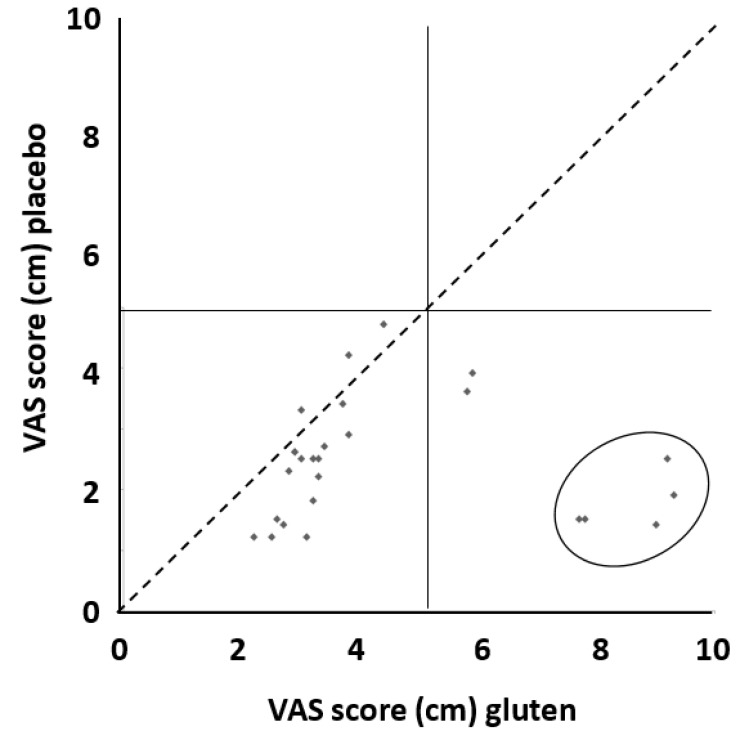
Figure 4.
Distribution of patients according to their VAS score while on gluten and placebo. Patients closer to the diagonal dashed line had a similar response to gluten and placebo. The two patients located in the lower right square but not included in the ellipse experienced a mild degree of the overall response. Patients included in the ellipse had a significant increase in VAS score ≥5.0 cm after gluten challenge (for the calculation of this value refer to the “Materials and Methods” section). The risk of symptom worsening after gluten assumption was increased by five times (95% CI 0.63 to 39.91) compared to placebo, although such a difference did not reach statistical significance. The absolute risk difference was 15% (95% CI − 1% to 32%).

