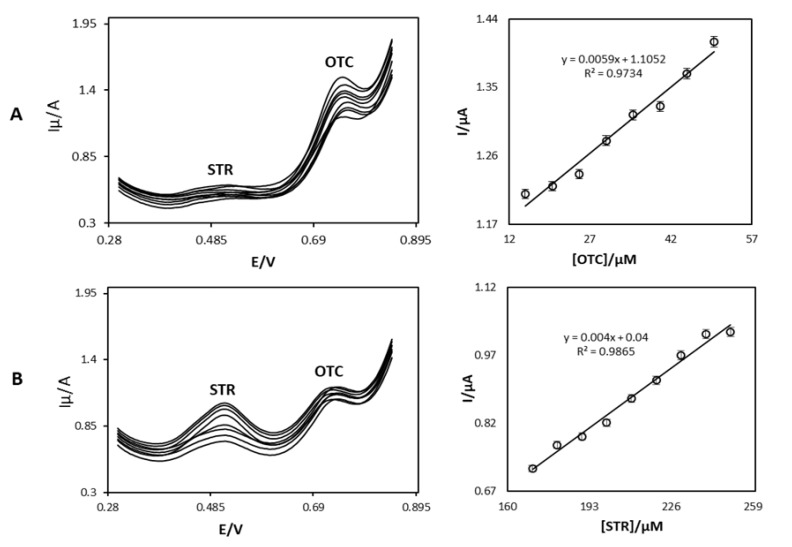
Figure 7.
(A) Differential pulse voltammograms of OB/SNPs/GO/SPE in a 0.1 M phosphate buffer solution pH = 7.0 containing 15.0 µM OTC and different concentrations of STR. Numbers 1–9 correspond to 170.0, 180.0, 190.0, 200.0, 210.0, 220.0, 230.0, 240.0, and 250.0 µM STR, respectively. Inset shows the plot of the electrocatalytic peak current as a function of STR concentration within the 170.0–250.0 µM range. (B) Differential pulse voltammograms of OB/SNPs/GO/SPE in a 0.1 M phosphate buffer solution pH = 7.0 containing 170.0 µM STR and different concentrations of OTC. Numbers 1–8 correspond to 15.0, 20.0, 25.0, 30.0, 35.0, 40.0, 45.0, and 50.0 µM OTC, respectively. Inset shows the plot of the electrocatalytic peak current as a function of OTC concentration within the 15.0–50.0 µM range.

