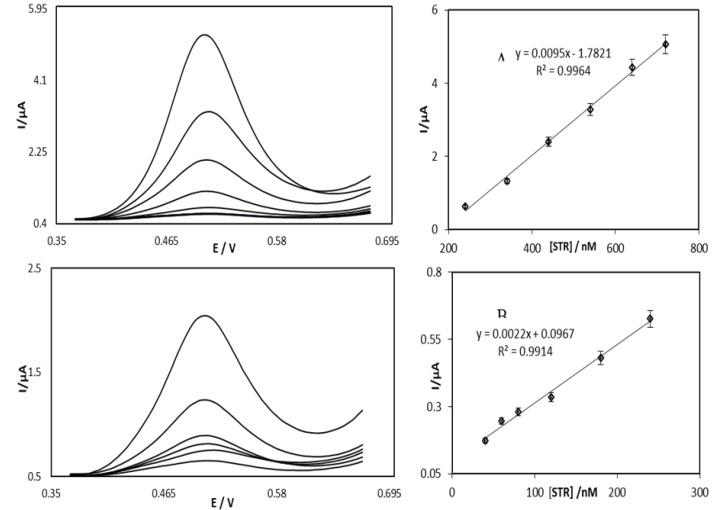
Figure 8.
Differential pulse voltammograms of the GO/OB/SNP/SPE in 0.1 M phosphate buffer solution pH = 7.0 containing different concentrations of STR (from 0.36 to 0.67 V and peak potential of 0.54 V). The voltammograms correspond to STR. Inset A shows the plots of the electrocatalytic peak current as a function of STR concentration in the range of 0.4 to 240.0 nM and inset B is the peak current as a function of STR concentration in the range of 240.0 to 720.0 nM.

