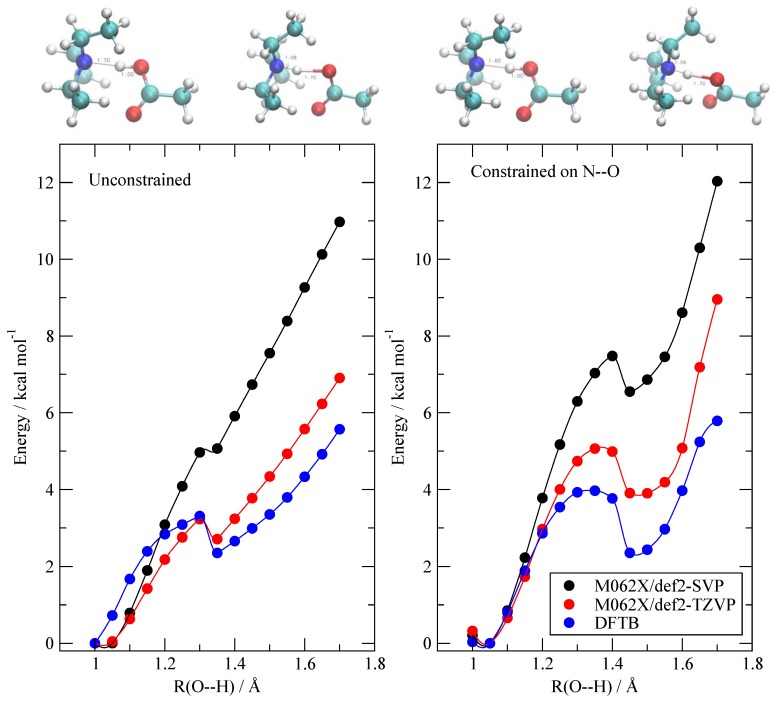
Figure 2.
Energy profile of the AcOH/TEA pair as a function of the AcO–H distance (see text for details). The black dots are the M062X/def2-SVP optimized energies. The red ones are M062X/def2-TZVP single point energies, and the blue ones are the density functional tight binding (DFTB) results. Left: scan without any further constraint except the O–H distance. Right: scan with an additional constraint that keeps the N–O distance fixed at its equilibrium value. To allow for comparison, the minimum energy in each set was set equal to zero. The structures on top correspond to the first and last geometries in each scan.

