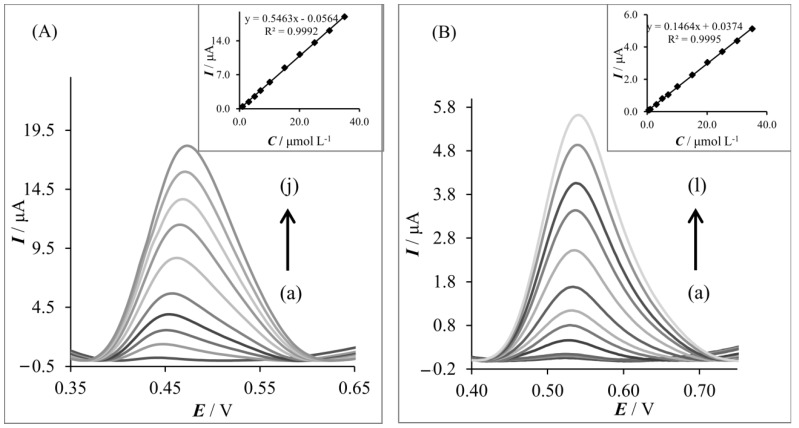
Figure 6.
(A) SWS voltammograms of AC on GFPE: (a) 1.0 μmol L−1, (b) 3.0 μmol L−1, (c) 5.0 μmol L−1, (d) 7.0 μmol L−1, (e) 10.0 μmol L−1, (f) 15.0 μmol L−1, (g) 20.0 μmol L−1, (h) 25.0 μmol L−1, (i) 30.0 μmol L−1, and (j) 35.0 μmol L−1. The inset shows the corresponding calibration curve. (B) SWS voltammograms of AC determination on MLGPE: (a) 0.5 μmol L−1, (b) 0.7 μmol L−1, (c) 1.0 μmol L−1, (d) 3.0 μmol L−1, (e) 5.0 μmol L−1, (f) 7.0 μmol L−1, (g) 10.0 μmol L−1, (h) 15.0 μmol L−1, (i) 20.0 μmol L−1, (j) 25.0 μmol dm−3, (k) 30.0 μmol L−1, and (l) 35.0 μmol L−1. The inset shows the corresponding calibration curve.

