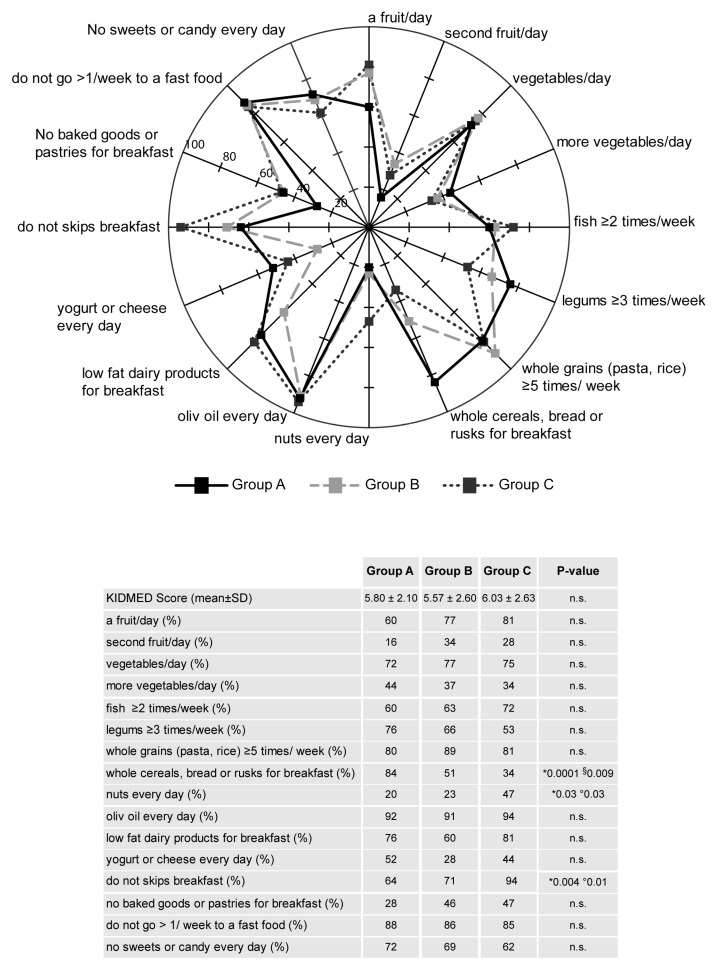
Figure 2.
Compliance with items from the KIDMED test in the three physical activity groups (Group A, B and C). The radar chart plots the values of each item of Mediterranean diet score along a separate axis that starts in the center of the chart (0% compliance) and ends at the outer ring (100% compliance). The KIDMED score (M ± SD) and frequency (%) of the population adherence to each recommendation are reported in the table. Statistical differences were evaluated by Chi-squared tests. p < 0.05, * Group A vs. Group C; ° Group B vs. Group C; § Group A vs. Group B.

