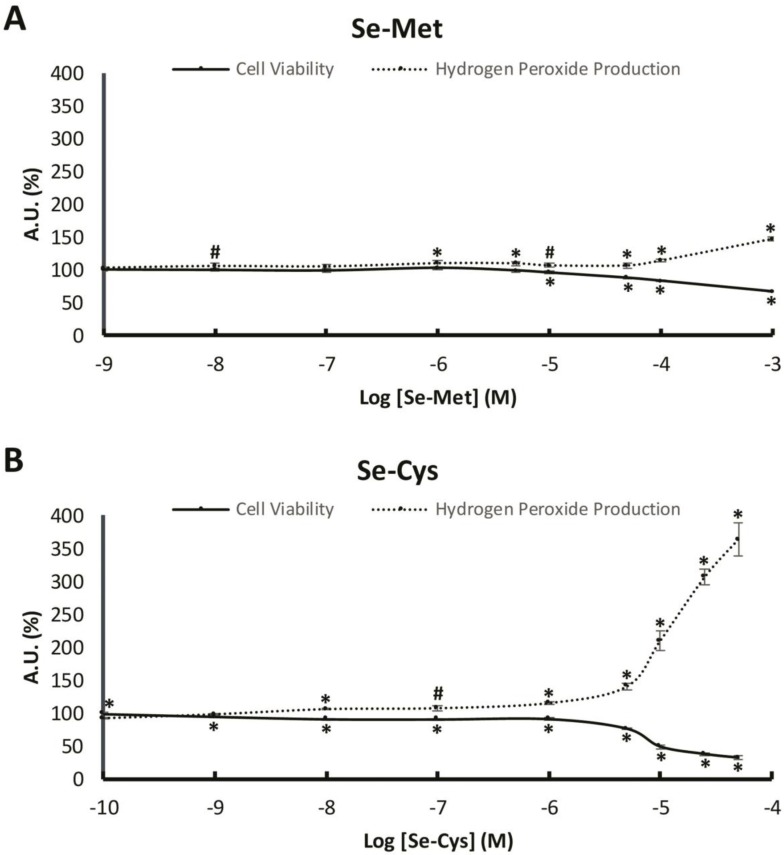
Figure 1.
Cell viability and hydrogen peroxide production in MCF-7 breast cancer cells after selenomethionine or selenocystine treatment. (A) The cells were treated with vehicle or with increasing concentrations of selenomethionine (from 1 nM to 1 mM) for 48 h. (B) The cells were treated with vehicle (data not shown) or with increasing concentrations of selenocystine (from 100 pM to 50 µM) for 48 h. Solid line represents the cell viability and pointed line represents hydrogen peroxide production. Points in lines represent means and error bars represent SEM (n = 6). The value of control cells was set at 100% (data not shown) and the rest of values were calculated referenced to the control set at 100%. * Significant differences between selenoamino acid treated and control cells (Student’s t-test; p ≤ 0.05). # Significant differences between selenoamino acid treated and control cells (Student’s t-test; p ≤ 0.1). AU: Arbitrary Units.

