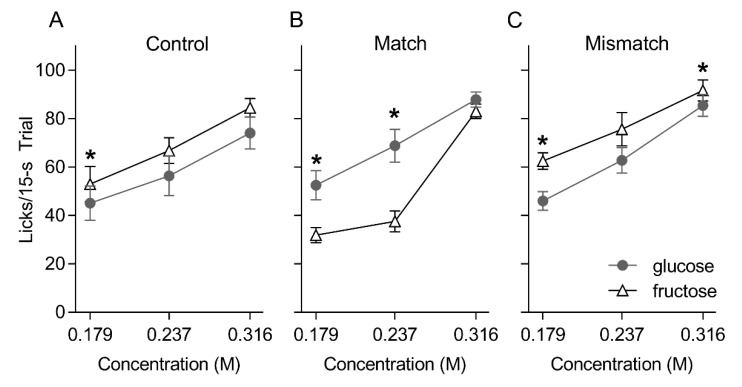
Figure 3.
Mean ± SEM licks to three concentrations of glucose and fructose presented in randomized order in 15 s trials for the Control (A), Matched (B) and Mismatched (C) training groups during the post-conditioning brief access taste test. Asterisks (*) indicate significant pair-wise differences (glucose versus fructose).

