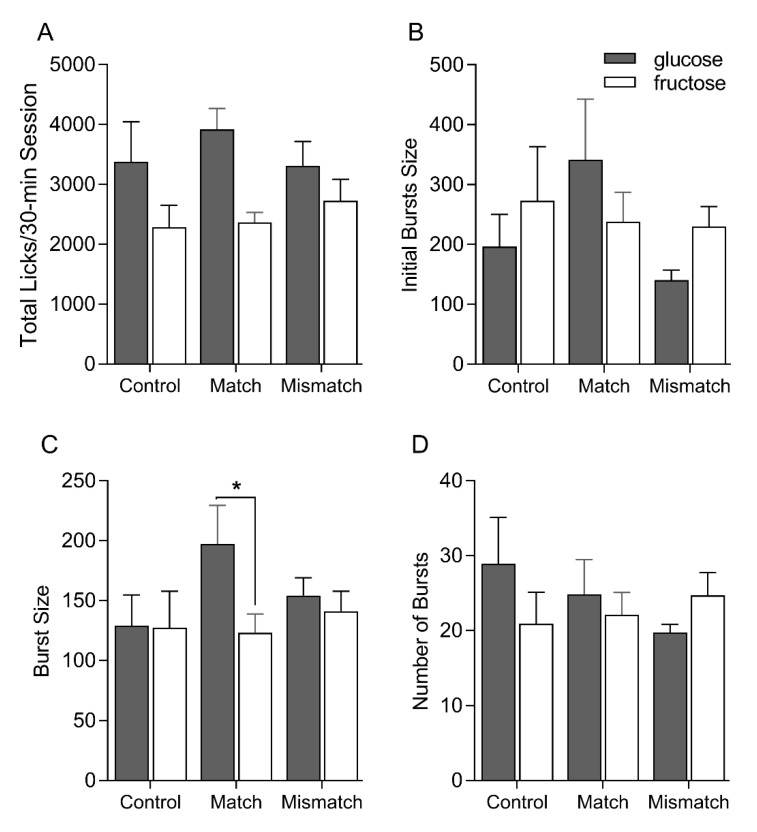
Figure 4.
Mean ± SEM total licks (A), initial bursts size (B), overall burst size (C) and overall number of bursts (D) on the post-conditioning single-bottle 0.316 M glucose and fructose intake test sessions for Control, Matched and Mismatched groups. Significant differences are indicated by asterisks (*).

