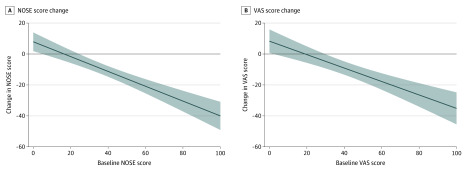
Figure. Regression Estimate of Change in Nasal Obstruction Symptom Evaluation (NOSE) Score and Visual Analog Scale (VAS) Score vs Baseline Score.
Both NOSE (A) and VAS (B) scores range from 0 to 100, where 100 indicates worst outcomes. Negative change in either score represents an improvement of nasal congestion.

