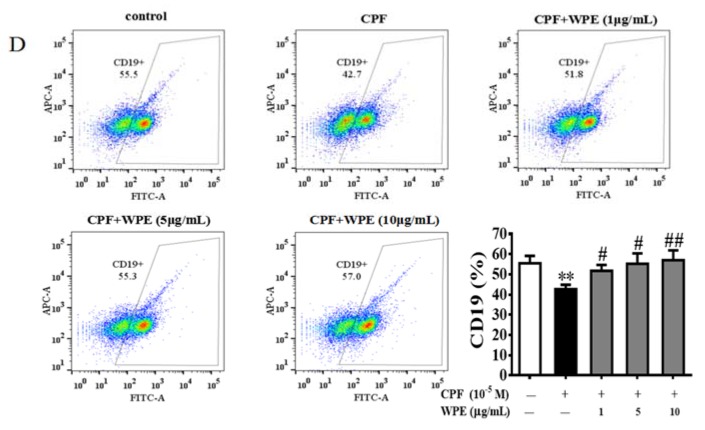
Figure 4.
Effect of WPE on MT- and CPF-induced cytotoxicity in splenic lymphocyte subpopulations by flow cytometry. (A) CD3+ T cells, (B) CD4+ T cells, (C) CD8+ T cells, and (D) CD19+ B cells in splenocytes exposed to medium only (control), MT (10−5 M), CPF (10−5 M), and WPE (1, 5, and 10 µg/mL) together with MT or CPF. Results are presented as mean ± SD of three separate experiments. * p < 0.05 or ** p < 0.01 vs. untreated control. # p < 0.05 or ## p < 0.01 vs. MT or CPF treatment.


