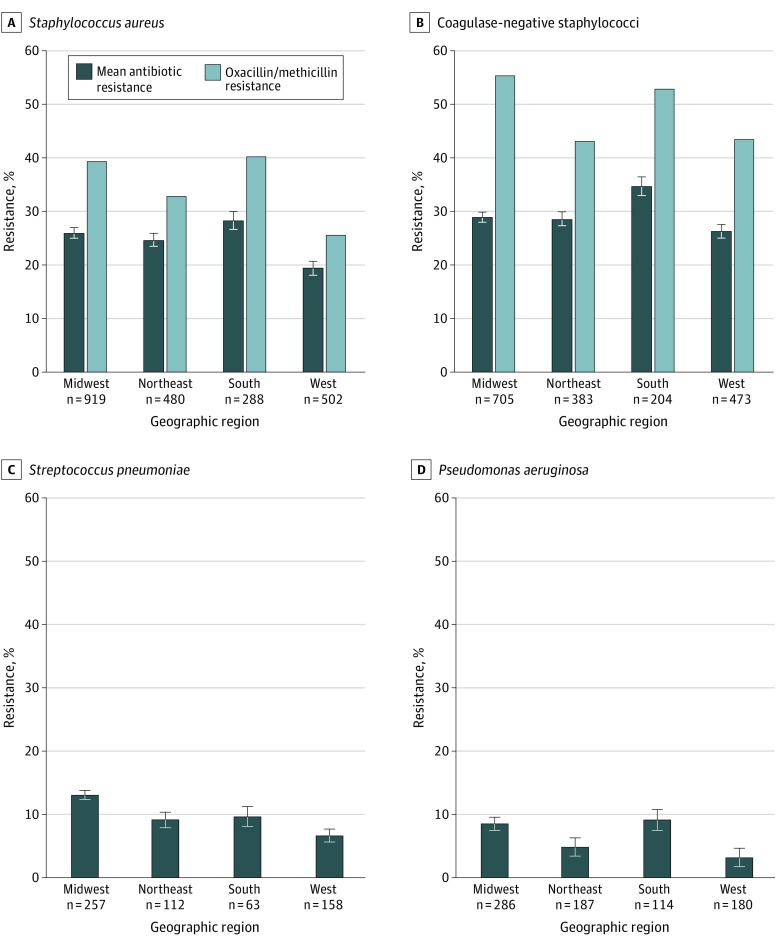
Figure 3. Mean Antibiotic Resistance and Methicillin Resistance Among Isolates by Geographic Region.
P values were calculated using analysis of variance (ANOVA) for mean resistance and the χ2 test for oxacillin/methicillin resistance. A, P < .001 by ANOVA and χ2 test. B, P = .003 by ANOVA and P < .001 by χ2 test. C, P < .001 by ANOVA. D, P = .005 by ANOVA. There was insufficient evidence to conclude that regions had different mean resistance percentages for the Midwest, Northeast, and South in A; the Midwest, Northeast, and West in B; the Midwest and South and the Northeast, South, and West in C; and the Midwest, Northeast and South and the Northeast and West in D. Error bars indicate standard error of the mean.

