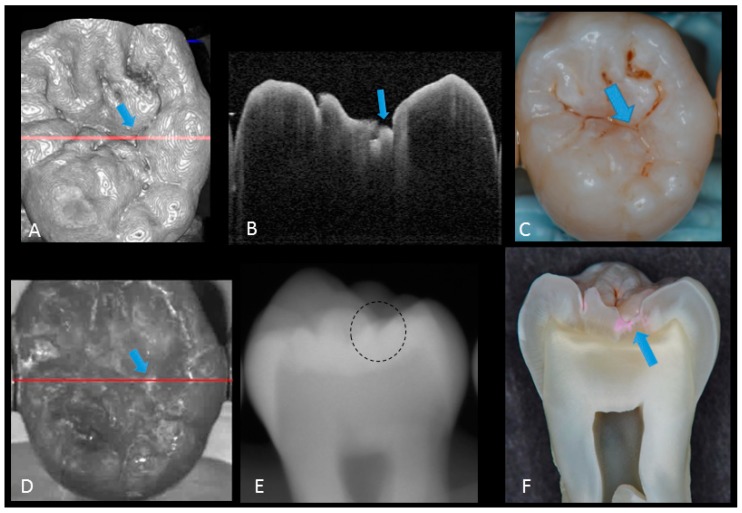
Figure 4.
Enamel breakdown: (A) gray-scale three-dimensional (3D) OCT image; (B) cross-sectional OCT image along the red line in (A) and (D). Arrow shows cavitated caries; (C) visual score 2 of enamel cavitation; (D) OCT en face intensity projection; (E) enamel lesion was not distinguished on radiograph due to the superimposition of buccal and lingual cusps; (F) cross-section view with penetration of pink dye enclosed at enamel (score 2). Supplementary Materials: Video 3.

