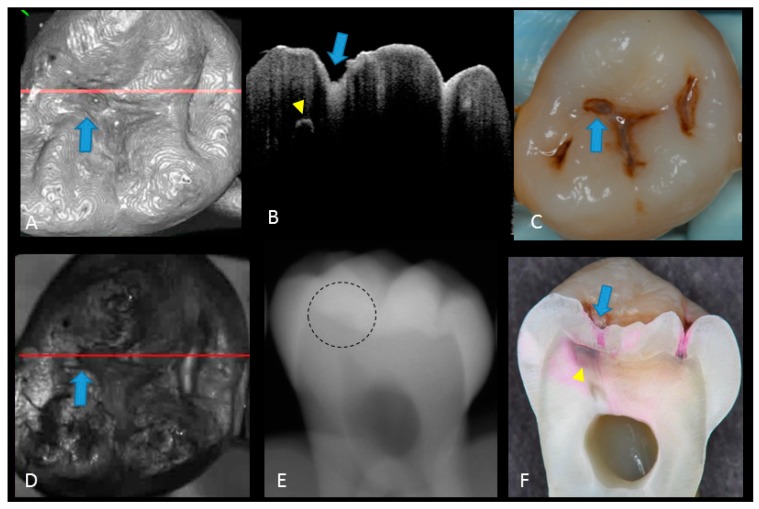
Figure 6.
Dentin caries: (A) gray-scale three-dimensional (3D) OCT image; (B) cross-sectional OCT image of the lesion along the red line in (A) and (D). A separation of DEJ (triangle) was observed at the bottom at the lesion (arrow) indicating the lateral invasion of bacteria; (C) visual score 3 with visible dentin; (D) OCT en face intensity projection; (E) radiolucent lesion at DEJ; (F) cross-section view with penetration of dark red dye one-third of dentin thickness. The dynamic slicing 3D video is presented in Supplementary Materials: Video 4.

