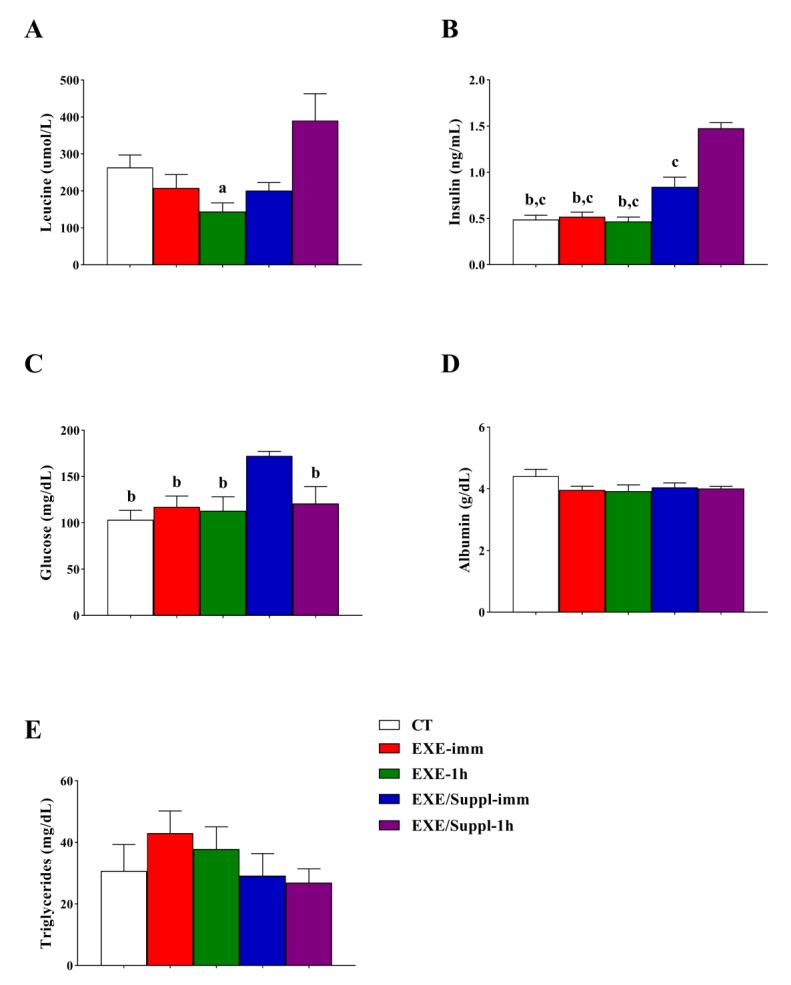
Figure 2.
Serum levels of leucine (A), insulin (B), glucose (C), albumin (D), and triglycerides (E). Data correspond to the mean ± SE of n = 22 rats. CT: sedentary rats without gavage after 10 h of fast (n = 4). EXE-imm: after 10 h of fast, rats were submitted to the resistance exercise protocol and received water gavage immediately after exercise (n = 4). EXE-1h: after 10 h of fast, rats were submitted to the resistance exercise protocol and received water gavage 1 h after exercise (n = 4). EXE/Suppl-imm: after 10 h of fast, rats were submitted to the resistance exercise protocol and received a protein blend gavage immediately after exercise (n = 5). EXE/Suppl-1h: after 10 h of fast, rats were submitted to the resistance exercise protocol and received a protein blend gavage 1 h after exercise (n = 5). a p ≤ 0.05 versus EXE/Suppl-1h; b p ≤ 0.05 versus EXE/Suppl-imm; c p ≤ 0.001 versus EXE/Suppl-1h.

