Figure 7.
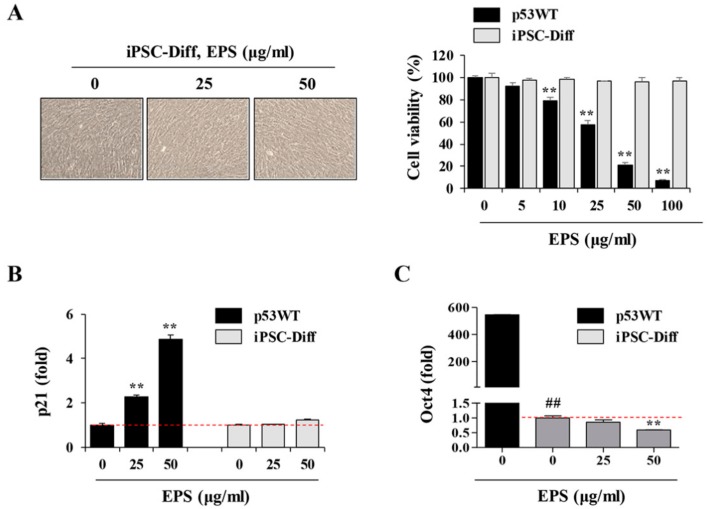
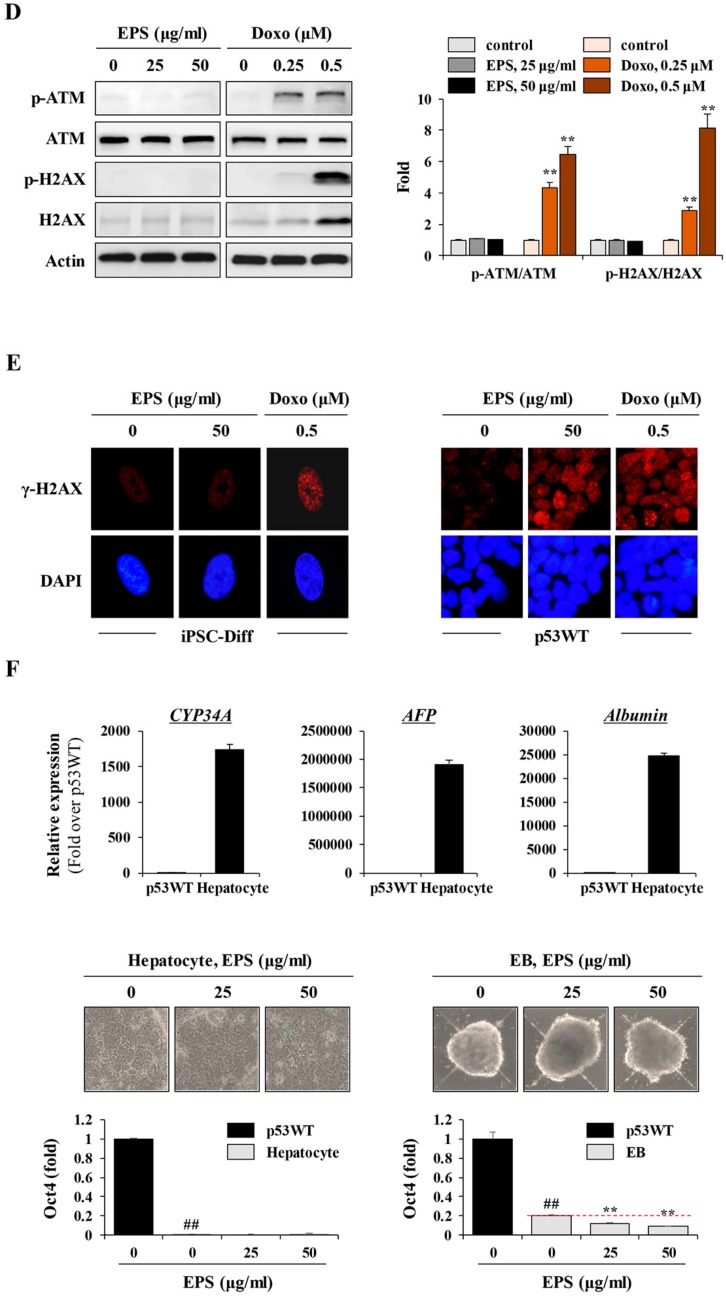
EPS has no cytotoxic effects on hiPSC-derived differentiated cells. (A) iPSC-Diff and p53WT hiPSCs were seeded on 12-well culture plates and treated with 25 and 50 µg/mL EPS for 24 h. Cell morphology was observed under an inverted microscope and cell viability was assessed by CCK-8 assay. Data are expressed as the mean ± SD from triplicate samples. (B,C) After treating iPSC-Diff with indicated concentrations of EPS for 12 h, the mRNA levels of p21 and Oct4 were measured by real-time PCR analysis. Data are expressed as the mean ± SD from triplicate samples and represented as fold increases relative to that of EPS-untreated cells. (D) iPSC-Diff were treated with 25 and 50 µg/mL EPS or 0.2 and 0.5 µM doxorubicin (doxo) for 24 h. The protein levels of p-ATM and p-H2AX were detected by Western blotting. The relative band intensities compared with EPS- or doxo-untreated control cells were calculated using Image J software after normalization to actin expression. Data are representative of two independent experiments. (E) iPSC-Diff and p53WT hiPSCs were treated with 50 µg/mL EPS or 0.5 µM doxo for 24 h or 3 h, respectively, and then immunostained with anti-p-H2AX antibody followed by Alexa 594-conjugated anti-rabbit antibody. Nuclei were stained with DAPI and γ-H2AX foci was observed under a fluorescence microscope. (F) Hepatic markers in p53WT and hiPSC-derived hepatocytes were analyzed by qPCR. Fold increase over p53WT was expressed as the mean ± SD from triplicate samples. Hepatocytes and embryonic bodies (EBs) were treated with 25 and 50 μg/mL EPS for 24 h. Morphological changes were observed under inverted microscope and the Oct4 mRNA level was determined by real-time PCR analysis. Data are expressed as the mean ± SD from triplicate samples and represented as fold increases relative to that of EPS-untreated iPSC-Diff. ** p < 0.01 vs. EPS-untreated control, ## p < 0.01 vs. p53WT.


