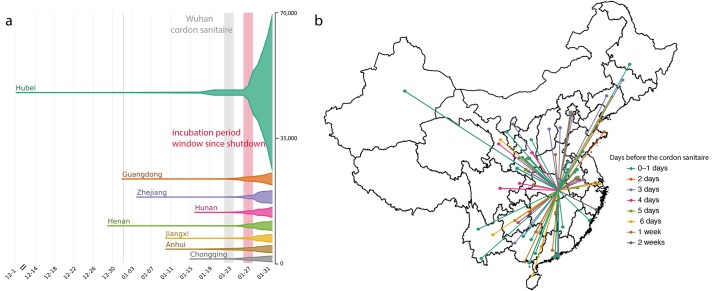
Fig. 1. Number of cases and key dates during the epidemic.
(a) The epidemic curve of the COVID-19 outbreak in provinces in China. Vertical lines and boxes indicate key dates such as implementation of the cordon sanitaire of Wuhan (grey) and the end of the first incubation period after the travel restrictions (red). The thin grey line represents the closure of Wuhan seafood market on 1st January 2020. The width of each horizontal tube represents the number of reported cases in that province. (b) Map of COVID-19 confirmed cases (n = 554) that had reported travel history from Wuhan before travel restrictions were implemented on January 23, 2020. Colors of the arrows indicate date of travel relative to the date of travel restrictions.

