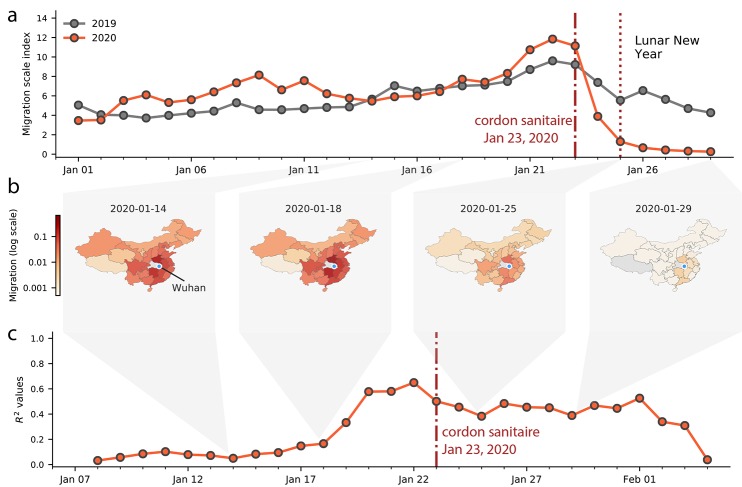
Fig. 2. Human mobility, spread and synchrony of COVID-19 outbreak in China.
(a) Human mobility data extracted in real time from Baidu. Travel restrictions from Wuhan and large scale control measures started on January 23,2020. Dark and red lines represent fluxes of human movements for 2019 and 2020, respectively. (b) Relative movements from Wuhan to other provinces in China. (c) Timeline of the correlation between daily incidence in Wuhan and incidence in all other provinces, weighted by human mobility.

