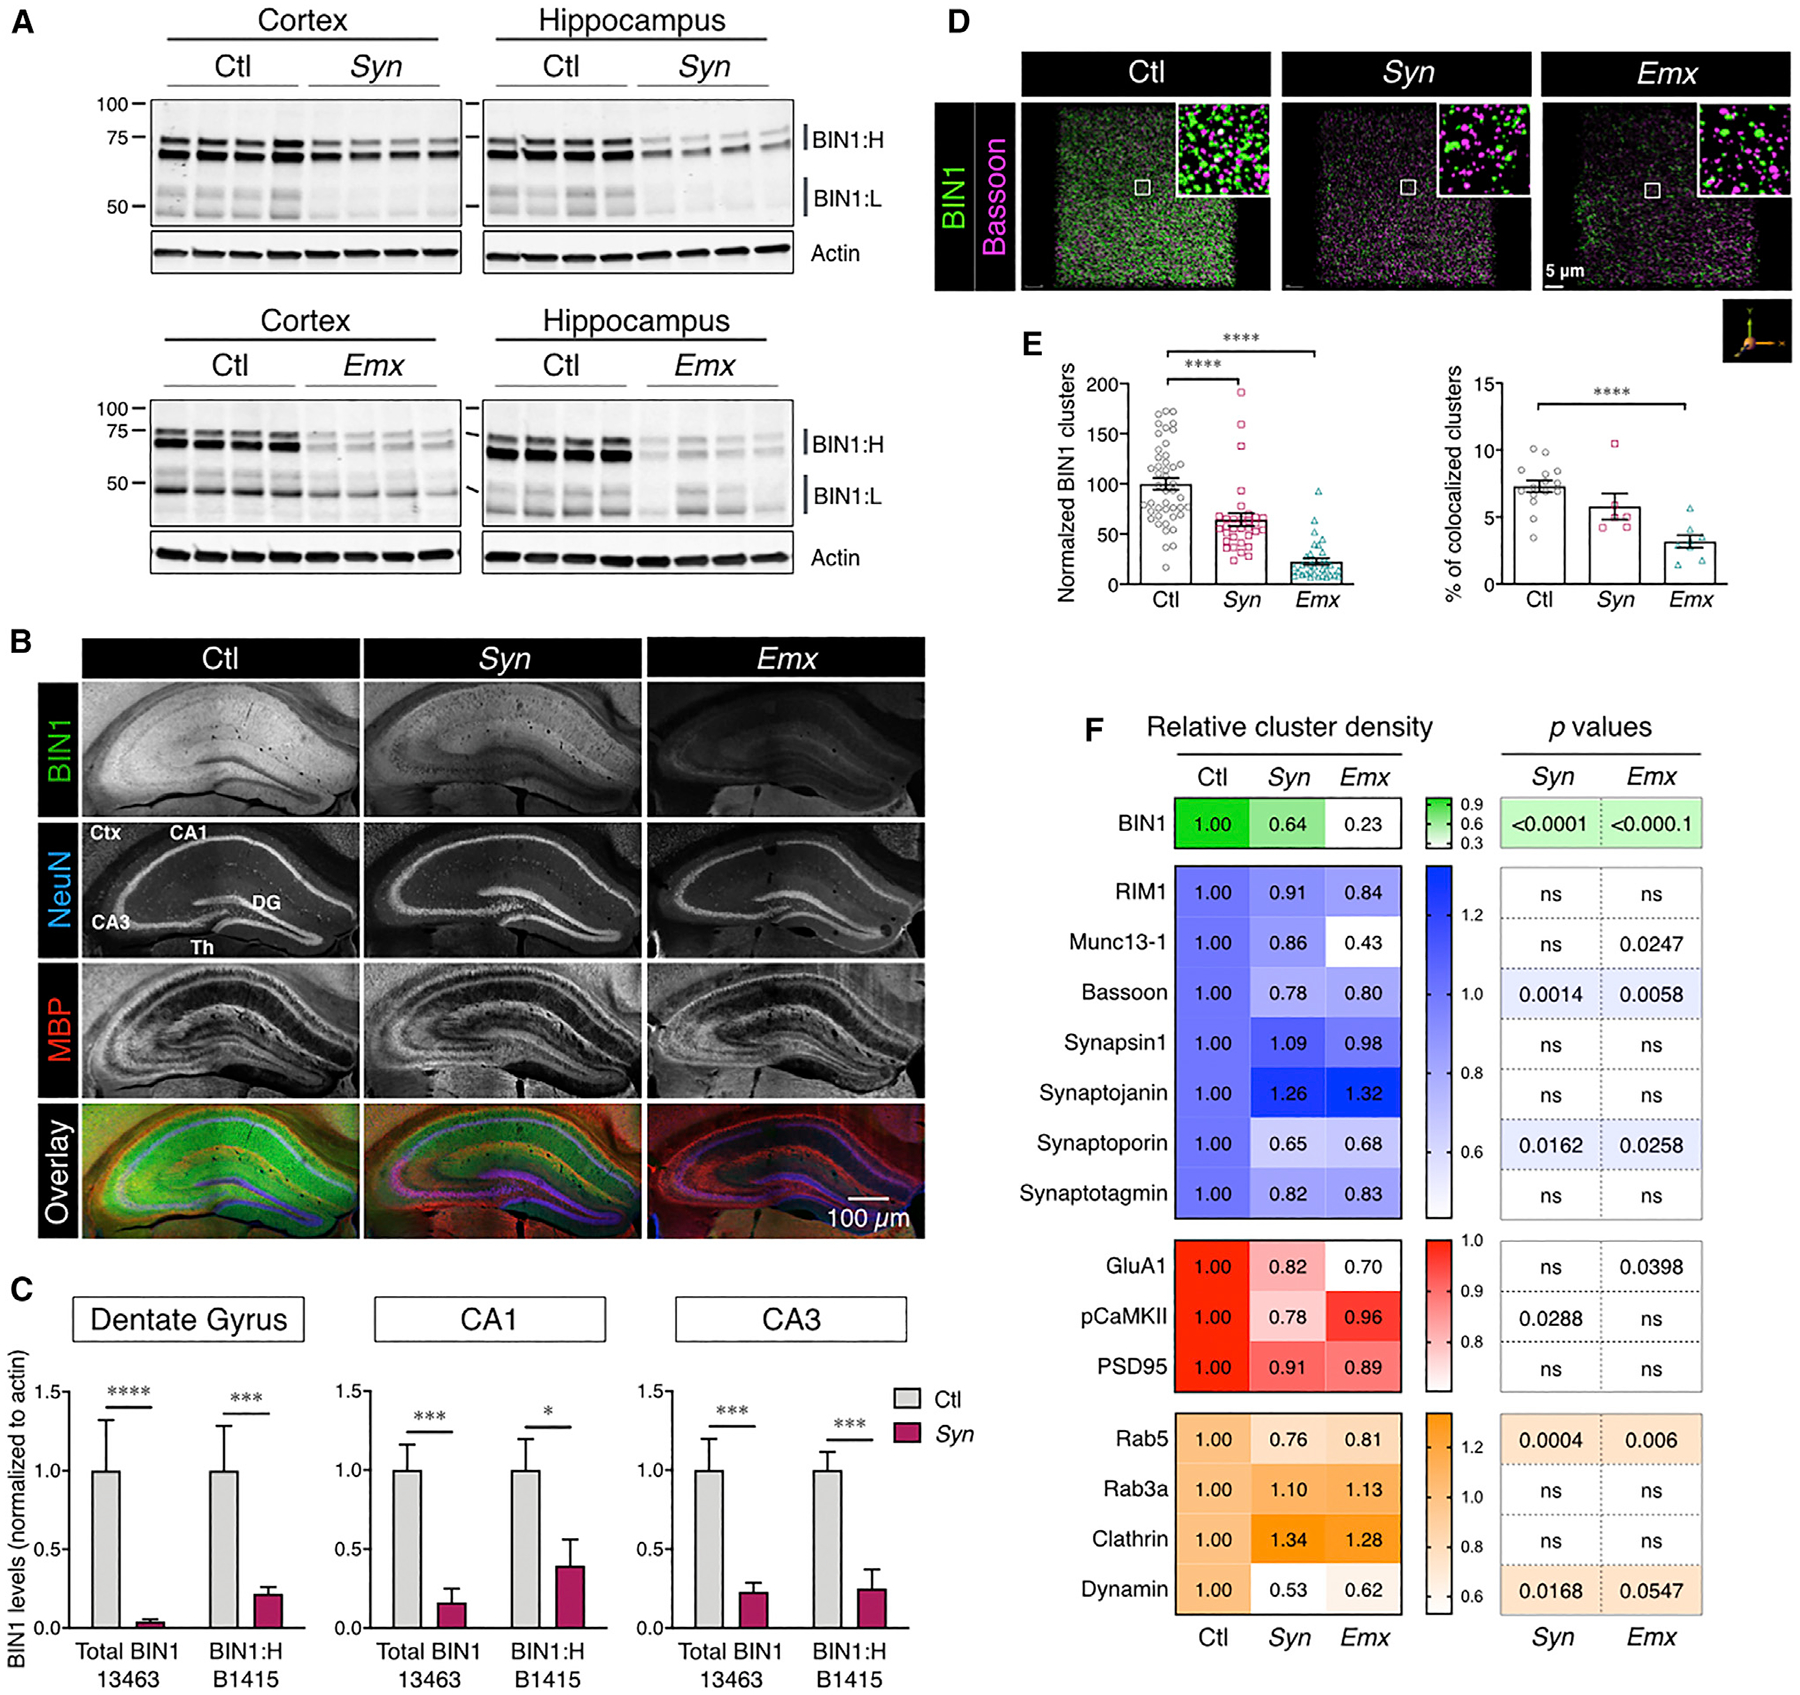
Figure 1. Loss of Neuronal BIN1 Expression in cKO Mice.

(A) Immunoblot analysis of BIN1 levels in the cortex and hippocampus of BIN1 cKO mice (polyclonal antibody [pAb] 14647).
(B) Confocal microscopy analysis of neuronal BIN1 expression in control (Ctl) and cKO (Syn and Emx) mice (mAb 13463; no epitope retrieval). Adjacent image panels acquired using a 10× objective were stitched together for the visualization of the entire hippocampus. Scale bar: 200 μm.
(C) Analysis of the diminution of BIN1 expression in the micro-dissected areas of the hippocampus of cKO mice. The means ± SEMs are plotted in each graph. *p < 0.05, **p < 0.01, ***p < 0.001, and ****p < 0.0001.
(D) Decreased presynaptic marker density in neuronal Bin1 cKO mice. Masks of BIN1 and Bassoon immunostaining in confocal images (see Method Details) were used to quantify synaptic marker densities from a block of 50 z stack images representing a depth of ~25 μm (96,193 mm3 volume).
(E) Decrease in BIN1 cluster density (left) in cKO mice (ANOVA: F(2, 107) = 50.7, p < 0.0001; Fisher’s LSD post hoc test: Ctl versus Syn and Ctl versus Emx p < 0.0001). Decrease of and BIN1-Bassoon colocalization, normalized to Bassoon cluster density (right) in Emx mice (ANOVA: F(2, 26) = 14.18, p < 0.0001; Fisher’s LSD post hoc test: Ctl versus Syn p = 0.0907 and Ctl versus Emx p < 0.0001).
(F) Heatmap representing mean changes in the density of different presynaptic markers (blue), postsynaptic markers (red), and presynaptic endocytic vesicle markers (orange).
See also Figures S1, S2, and S7 and Tables S1 and S2.
