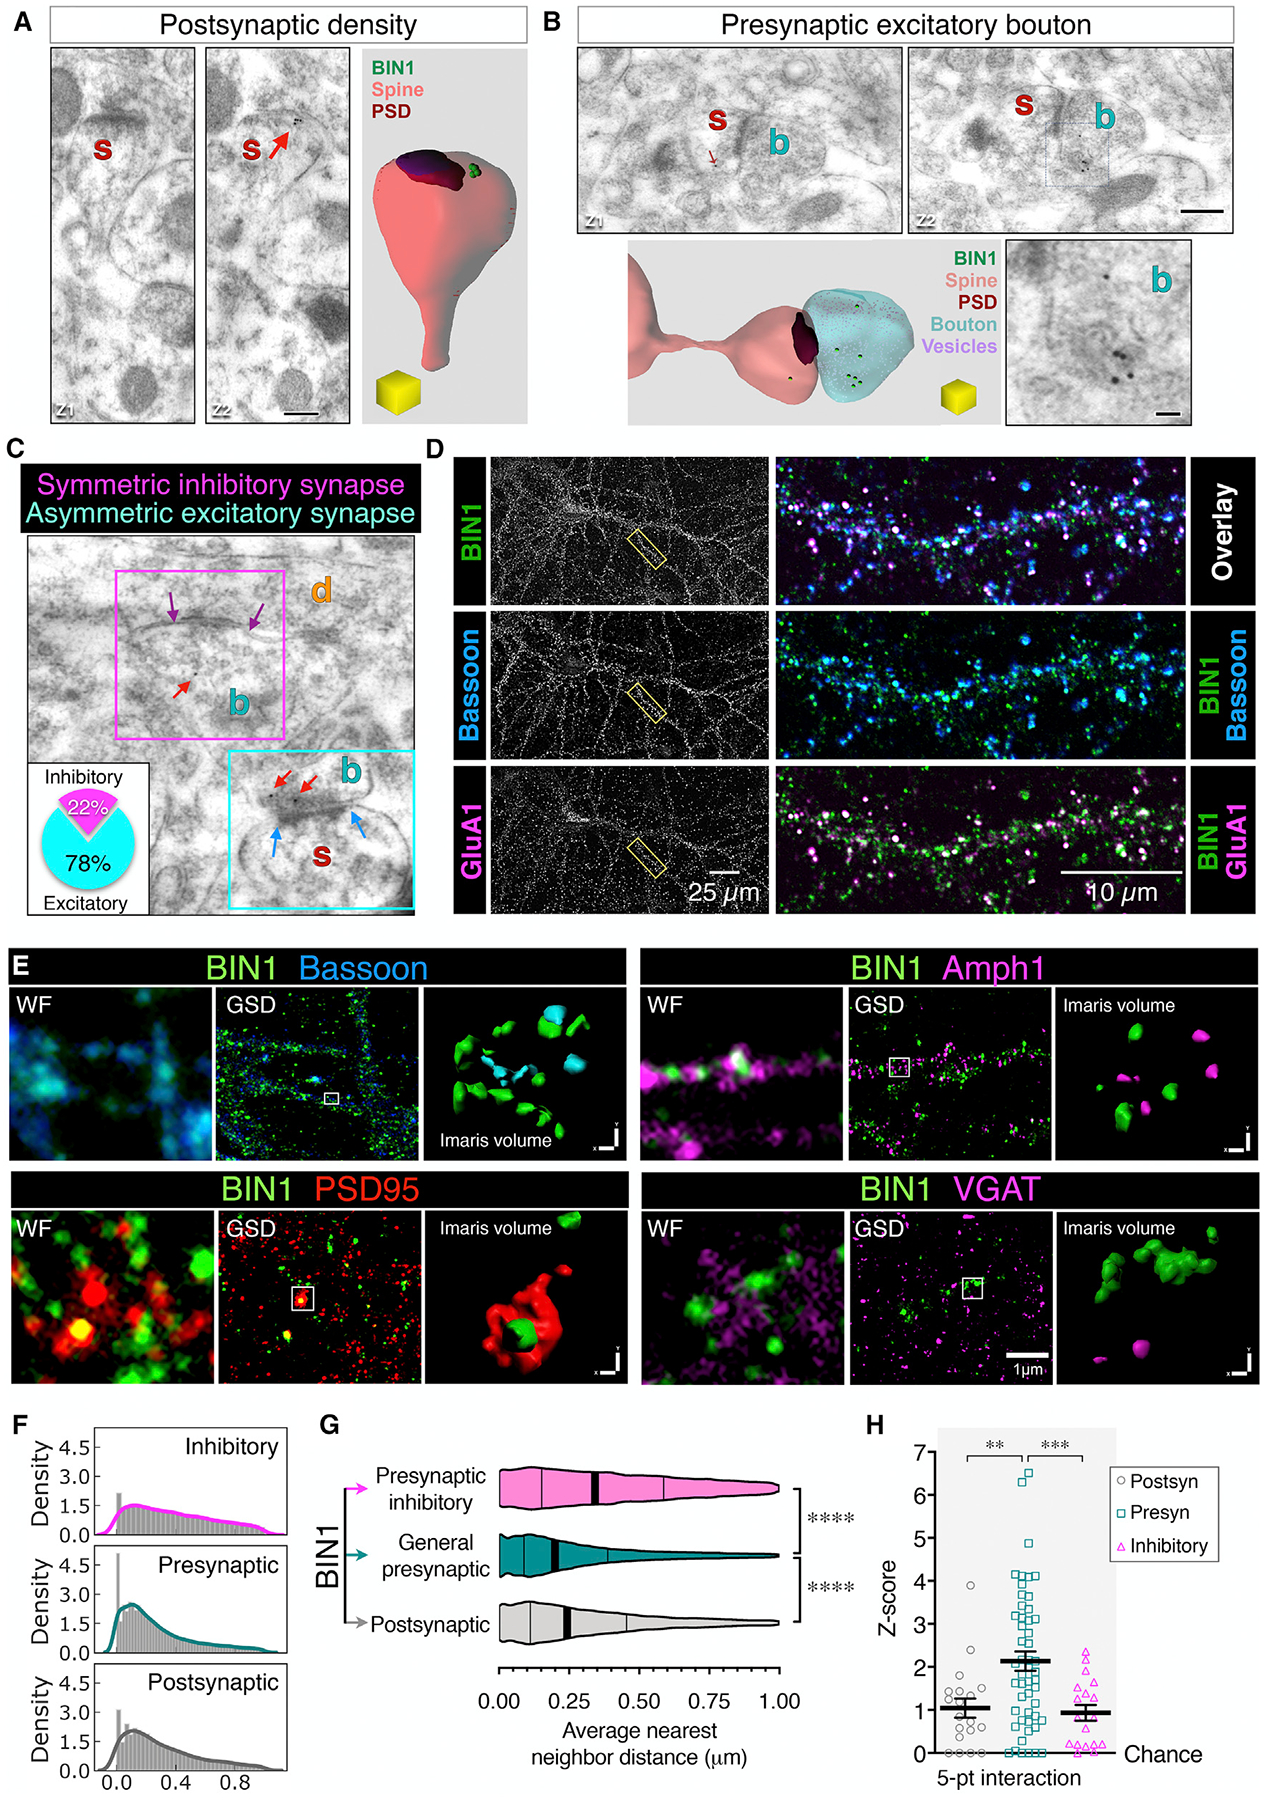
Figure 5. Investigation of BIN1 Synaptic Localization Using Immuno-EM and Ground-State Depletion (GSD) dSTORM Microscopy.

(A–C) Representative images of BIN1 immuno-EM localization in the mouse hippocampal CA1 region, showing BIN1-associated gold particles in the postsynaptic (A), general presynaptic (B), and inhibitory synapses (C). The inset in (C) indicates that of all of the synapses with BIN1-immunogold particles, 78% were excitatory terminals. Scale bars: 250 nm; enlarged inset, 50 nm.
(D) Representative confocal images of BIN1, Bassoon, and GluA1. Image overlays of the boxed region are shown at a higher magnification at right.
(E) Representative images of BIN1 (green) and markers for postsynaptic sites (PSD95; red), presynaptic sites (Bassoon; blue), and inhibitory presynaptic sites (Amph1 and VGAT; magenta). For each marker, the widefield image (WF), the super-resolution image (GSD), and the Imaris volume view (used for nearest-neighbor calculation) of the identical region are displayed.
(F) The density plot depicts the frequency of the distance between the BIN1 clusters and synaptic markers. The x axis indicates the binned DBSCAN average nearest-neighbor distance (microns) between BIN1 and synaptic markers.
(G) Violin plot of the average distance between BIN1 and its nearest neighbor. ANOVA analysis (F(2, 80700) = 1,332, p < 0.0001); BIN1-to-marker mean distance: general presynaptic markers = 0.2708 ± 0.001 μm; postsynaptic markers = 0.308 ± 0.002 μm; and presynaptic inhibitory markers = 0.3849 ± 0.002 μm). The vertical lines indicate the median and quartiles.
(H) DBSCAN analysis of randomization score to assess the specificity of BIN1 approximation to synaptic markers (5-point interaction; 50 points per cluster at 50-nm distance). The Z-score analysis showed a specific association of BIN1 with the synaptic markers; ANOVA analysis (F(8, 255) = 5.446, p < 0.0001). When the Z score equals 0, the association between BIN1 and the markers is not greater than a chance occurrence.
See also Figures S4–S6 and Table S1.
