
Figure 6. Decrease in the Volume of SNARE-Regulating Proteins in cKO Mice.
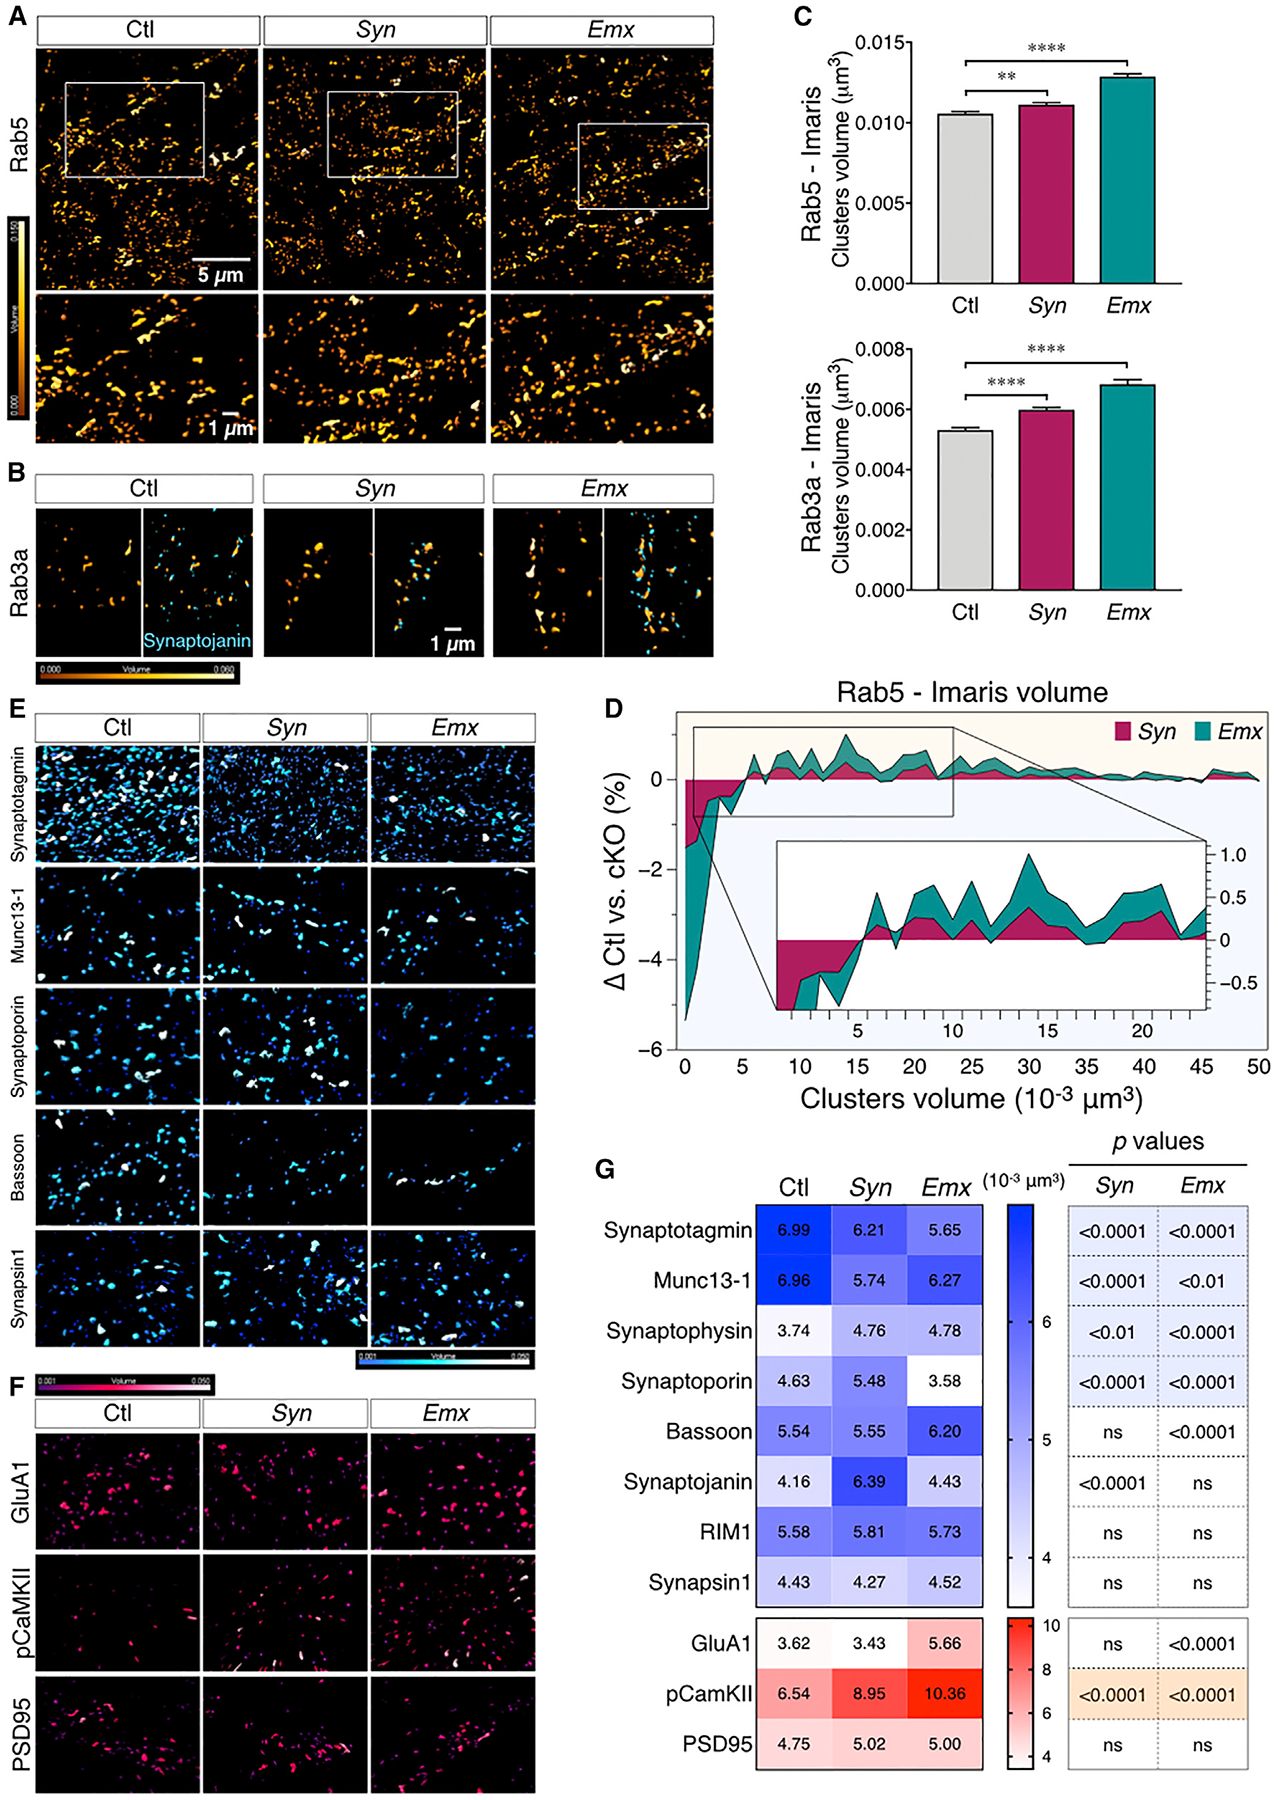
(A) Representative images of Rab5 cluster intensity-coded by volume size (Imaris). The boxed region is shown at higher magnification in the bottom panels.
(B) Rab3a clusters (left, coded by volume size) and two-color images (intensity-coded by volume) depicting the close proximity of Rab3a clusters to synaptojanin (right).
(C) Bar graphs representing the analysis of Rab5 and Rab3a cluster volumes in Ctl and cKO mice. ANOVA with Fisher’s LSD post hoc test revealed a significant increase in the cluster volume sizes for Rab5 (F(2, 47322) = 60.43, p < 0.0001, Ctl versus Syn p = 0.0018, Ctl versus Emx p < 0.0001) and Rab3a (F(2, 25397) = 50.55, p < 0.0001, Ctl versus Syn and Ctl versus Emx p < 0.0001).
(D) Stacked area plot of the difference in Rab5 cluster-size frequency distribution between Ctl and cKO. The difference in distribution was calculated as [(number of Rab5 clusters/volume)Ctl (number of Rab5 clusters/volume)cKO], with a bin size of 0.001 μm3. For clarity, only the clusters ranging from 0.001 to 0.05 μm3 are shown in the plot. The inset shows an enlarged area of the plot.
(E and F) Representative images of presynaptic (E, blue) and postsynaptic (F, red) protein clusters generated with Imaris and intensity-coded by volume (from 0.001 to 0.05 μm3).
(G) Heatmap representation of the mean variation of presynaptic and postsynaptic protein cluster volumes.
See also Figures S7 and S8 and Table S3.