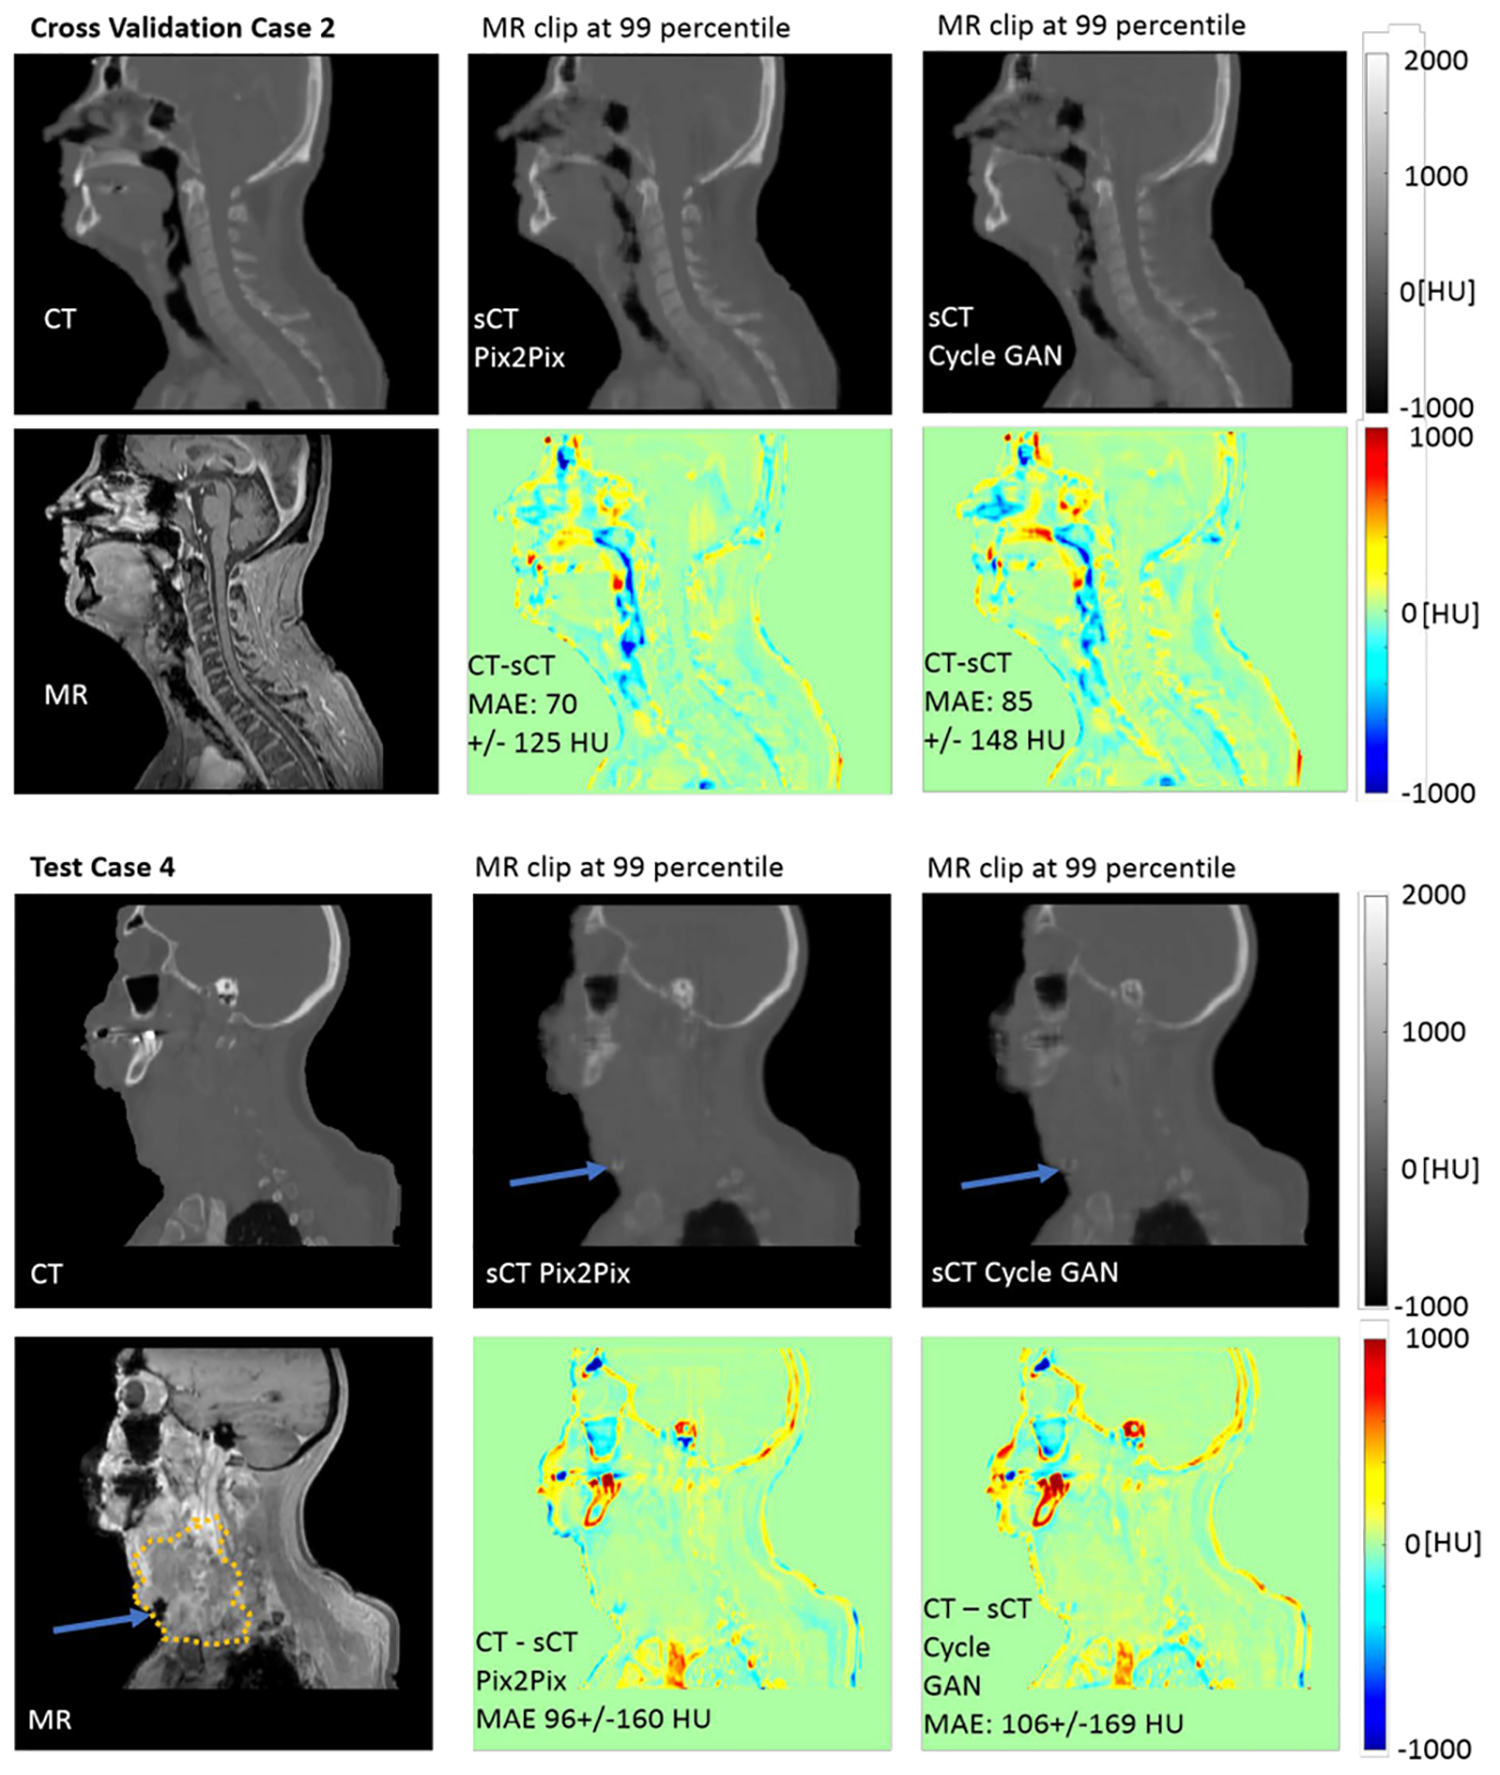
Figure 6). (Top).

Example sCT images for Cross Validation Case 2 with sCT patches from the three views combined by averaging, showing the similarities and differences between the resultant pix2pix and CycleGAN sCT images. The most notable differences in the sagittal view are in the sinuses, nasopharynx and with the tongue. (Bottom) Example sCT images for Test Case 4, which included a large tumor (GTV highlighted with dotted line). Both pix2pix and CycleGAN estimate the HU values for the soft tissue of the tumor well, except for a small region at the anterior inferior part of the tumor recorded with low intensities in the MR image that was incorrectly transformed to bone-valued HUs.
