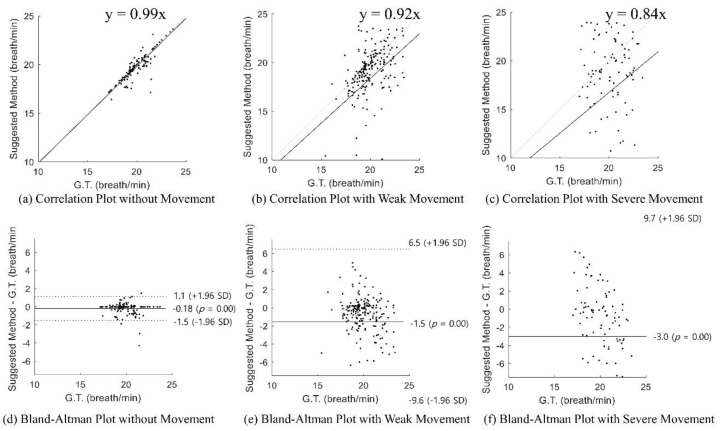
Figure 9.
Statistical evaluation of the respiration rate detection over long periods: (a) correlation plot without movement, (b) correlation plot with weak movement, (c) correlation plot with severe movement, (d) Bland–Altman plot without movement, (e) Bland–Altman plot with weak movement, and (f) Bland–Altman plot with severe movement.

