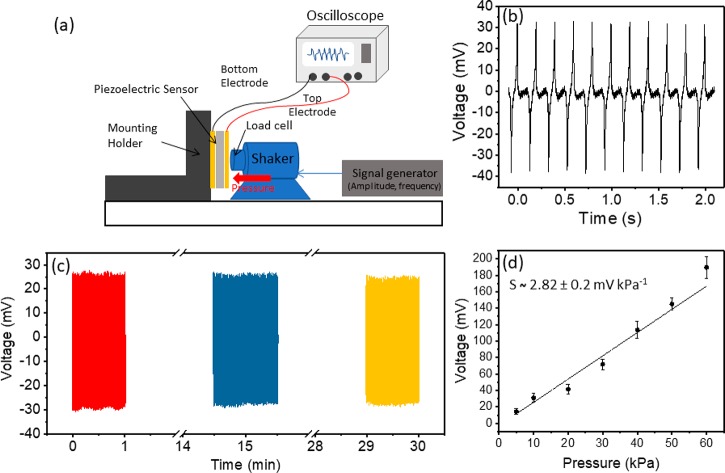
Figure 7.
(a) Schematic of the characterization setup consisting of a shaker/vibration generator for measuring the sensor’s sensitivity. (b) Output voltages of the β-Gly/CS sensor under a 10 kPa applied pressure. (c) Cyclic measurement of the output voltage of the sensor for 9000 times repeated measurement at a pressure of 10 kPa and 5 Hz frequency. (d) Piezoelectric sensitivity of the sensor as a function of applied pressure.

