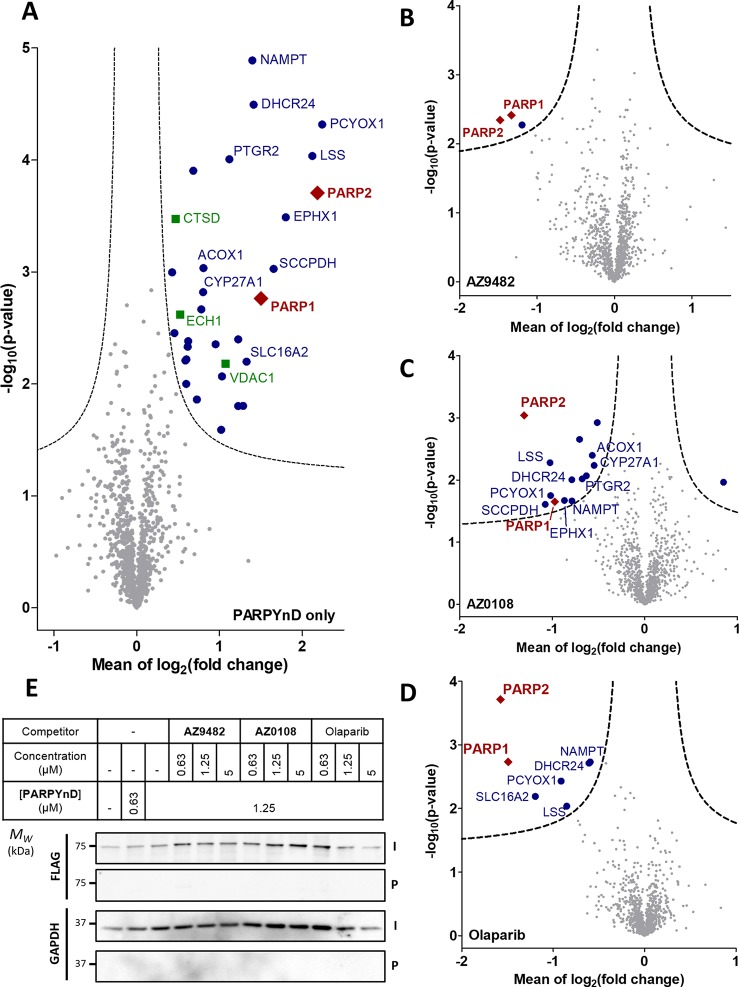
Figure 3.
Target engagement profiles of PARPYnD, AZ9482, AZ0108, and olaparib. (A–D) Proteomics analysis of live cells labeled with PARPYnD and ligated to AzRB (Figure S3B) with/without cotreatment with parent competitor molecules. Tagged proteins were enriched on NeutrAvidin agarose, digested into peptides, and tandem mass tag (TMT) labeled for identification and quantification by LC-MS/MS. Volcano plots demonstrate enrichment (x axis) of one sample versus another and the associated significance (y axis), determined by pairwise Student’s t test (cut off: A, S0 = 0.1, false discovery rate (FDR) = 5%; B–D, S0 = 0.1, FDR = 15%). Red diamonds = PARP family, blue dots = other significantly enriched/depleted hits, green squares = known background photocrosslinking binders,26 gray dots = nonsignificant proteins. Significant hits are annotated with their gene names only when they are appear significantly enriched/depleted across more than one pairwise comparison, with the exception of the known background binders. Larger, fully annotated plots can be found in Figure S5A–D, and complete raw data can be found in the Supporting Information, Extended Data S2. (A) PARPYnD (1 μM) versus DMSO. (B) PARPYnD (1 μM) and AZ9482 (5 μM) versus PARPYnD (1 μM) only. (C) PARPYnD (1 μM) and AZ0108 (5 μM) versus PARPYnD (1 μM) only. (D) PARPYnD (1 μM) and olaparib (5 μM) versus PARPYnD (1 μM) only. (E) Transient overexpression of FLAG-PARP6 and attempted enrichment of the overexpressed protein and identification by Western blot. I = input (whole lysate); P = pull down (enriched fraction).

