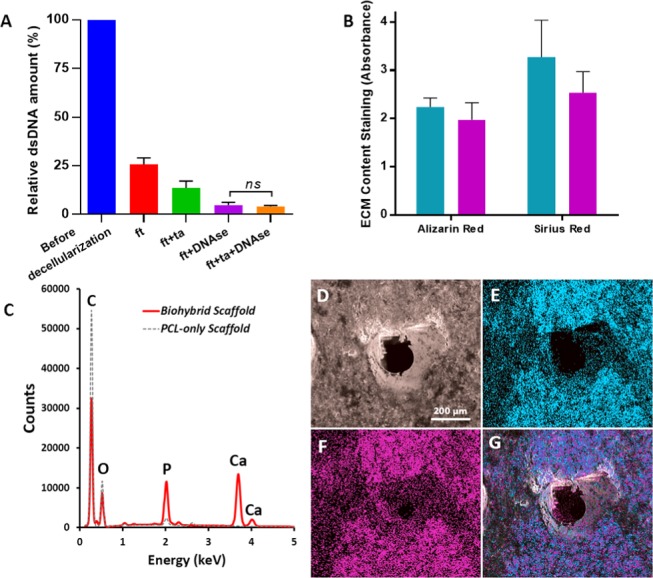
Figure 7.

(A) Comparison of the various decellularization techniques in terms of remaining DNA content (n = 3), (B) Calcium and collagen content of the scaffolds cultured with MLOs for 4 weeks (blue) and scaffolds that are decellularized (purple) (n = 3, ns: not significant, p > 0.05), (C) EDX spectrum of the decellularized scaffold showing the peaks of carbon (C), phosphorus (P), calcium (Ca), and oxygen (O), (D) SEM image of the decellularized scaffold, (E–G) EDX elemental mapping of Ca (blue), P (pink), and merged mapping (Ca and P), respectively.
