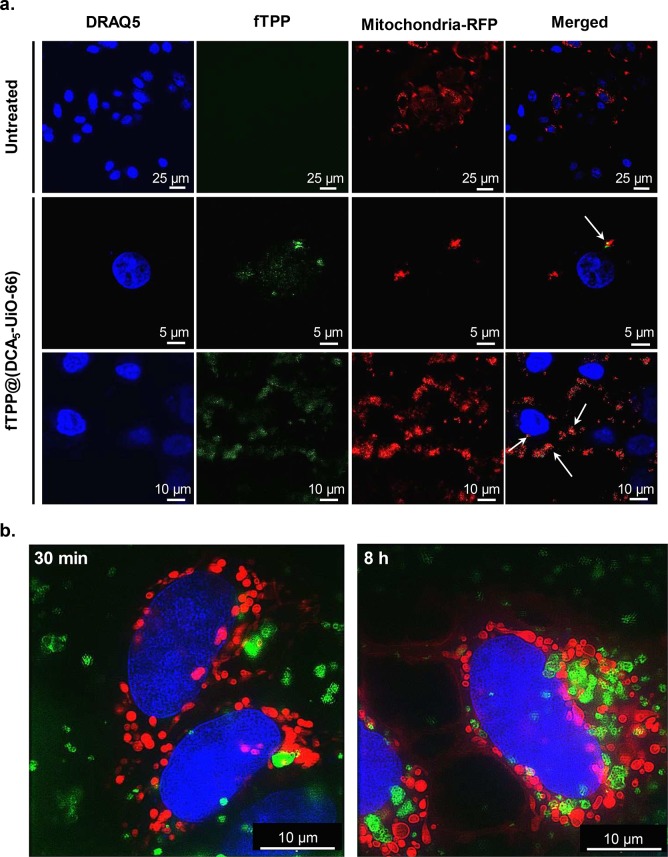
Figure 2.
Microscopy imaging of MCF-7 cells. (a) Confocal microscopy images of cells incubated for 2 h with fTPP@(DCA5-UiO-66). (b) SIM images of cells incubated for 30 min (left) and 8 h (right) with cal-TPP@(DCA5-UiO-66). fTPP and calcein are shown in green, mitochondria stained with RFP are shown in red, and nuclei stained with DRAQ-5 are shown in blue. White arrows in confocal microscopy show overlap between red and green signals.

